To display tabs
Axes are chart components that are used to organize data on a chart.
Headers of table rows and columns form a coordinate grid that enables the user to determine each cell's address. The similar function is executed with by the category axis (X) and the value axis (Y) on a chart. Category axes and value axes match on a bubble chart. Horizontal and vertical axes are value axes.
To set up chart axis parameters, use the X Axis and Y Axis side panel tabs. The sets of parameters match on both tabs.
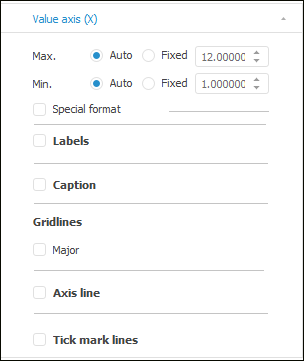
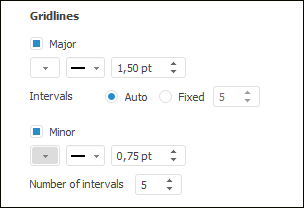
Determine the following settings for bubble chart axis on the tab:
Maximum and minimum axis value
See also: