 Create a data area
How to set up data area totals by dimension levels?
Total values can be displayed for any data area. To improve information contents, it is available to display total values associated with dimension levels.
The data area looks as follows:

Display the following total values for the presented data:
The sum of indicators for dimension level child elements.
The sum of indicators for all dimension level elements.
Determine parameters for displaying values of data area totals. To do this:
Select any cell in this area and select the Data Area Parameters context menu item.
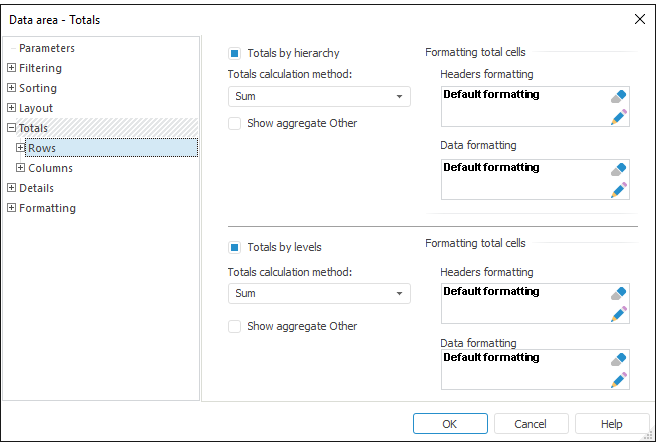
Go to the Totals > Rows tab in the Data Area Properties dialog box and determine the following parameters:
To set up displaying sum of indicators by child elements of dimension levels:
Select the Totals by Hierarchy checkbox.
Select the Sum item in the Totals Calculation Method combobox.
To set up displaying sum of indicators by all elements of dimension levels:
Select the Totals by Levels checkbox.
Select the Sum item in the Totals Calculation Method combobox.

NOTE. Totals by levels and dimensions are set up similarly to the totals by rows and columns.
Click the OK button to save settings.
To apply the settings, calculate the data area.
After this the data area looks as follows:

To visualize calculated totals, the following formatting is applied:
Totals by levels are highlighted with red.
Totals by hierarchy are highlighted with blue.
Thus, data area aggregation by dimension levels has been set up.
See also: