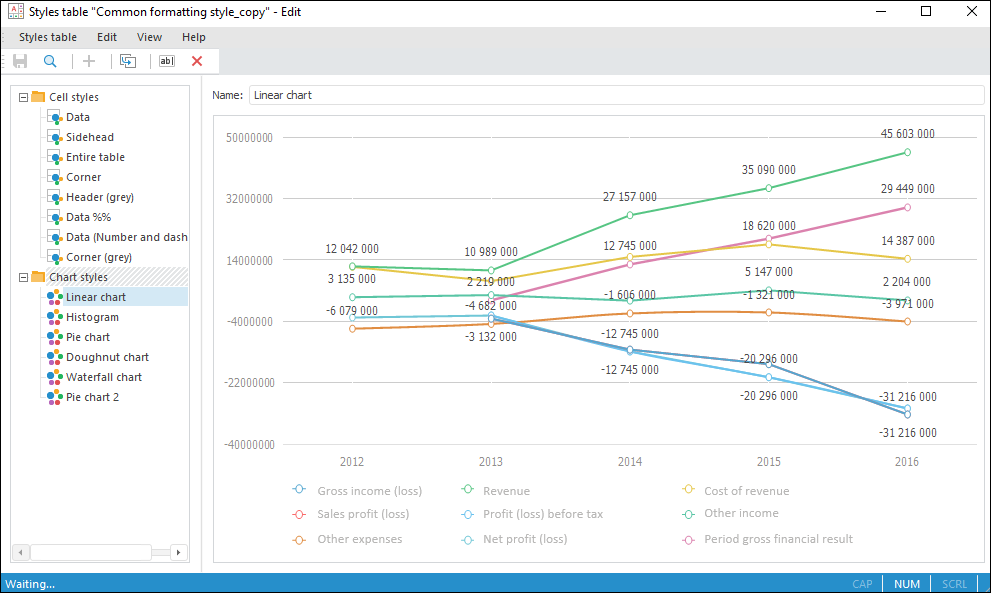
For uniform style formatting of visualizers in various Foresight Analytics Platform tools one can use a styles table:

Key features:
Maintenance of common styles for visualizers:
Table.
Chart.
Common chart legend. It is available only in the Reports tool.
Bubble chart.
Bubble tree.
Tree map.
Map.
NOTE. In the web application style setup in styles table is available only for table visualizers.
Application of uniform styles in the tools: Dashboards, Analytical Queries (OLAP), Reports, Time Series Analysis.
NOTE. In the web application styles can be applied from styles tables in the Reports tool and the Interactive Data Entry Forms extension.
Creation of several styles tables to use them in formatting various report groups.
To get started with the tool, see the Getting Started with Styles Table article.
To create a styles table, see the Creating Styles Table article.
To work with ready styles table, see the Working with Ready Styles Table article.
See also: