The tool supports interface of Foresight Analytics Platform 9 or earlier.
The Variable Reports panel is used to get summary reports by all input and output variables included into a modeling problem. The scenario dimension of reports contains all scenarios, based on which a modeling problem can be calculated.
An input variable of the problem is a variable, which is not output in neither of the models included into the problem. An output variable of the problem is a variable, which is output at least in one model included into the problem.
The possible input variables are the following:
Input variable if it differs from the output variable.
Factor if it is not used as an output variable.
An output variable in the model is an output variable. An output variable can also be a factor or an input variable if it matches the output variable.
To open the report containing data of the particular type of variables, use the Input Variables Report and Output Variables Report buttons. To get the report containing data of all variables including the ability to compare data by all scenarios in the modeling problem, use the Scenarios Comparison Report button.

The report opens in a new window.
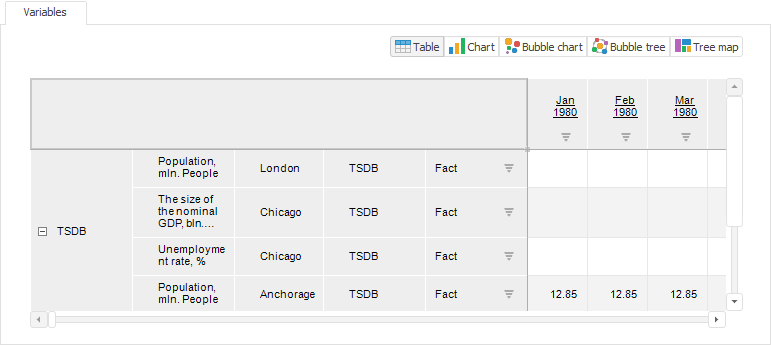
All reports contain the Variables sheet that includes input and output variables as tables for the selected period by all considered scenarios. For example:

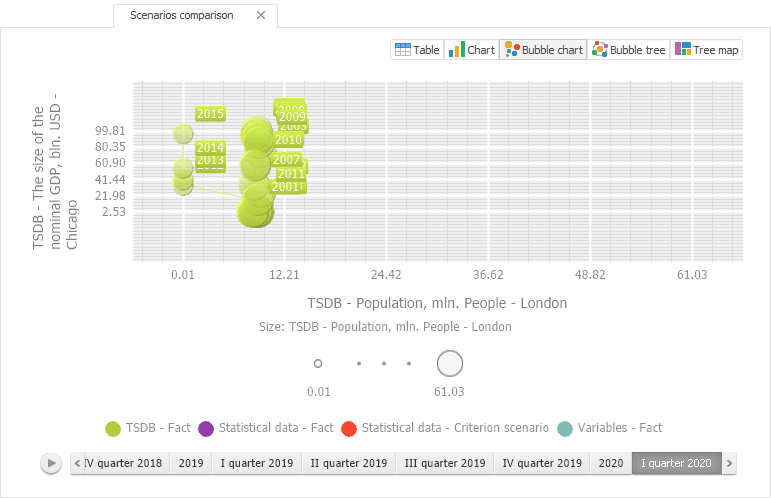
The scenarios comparison report also contains the Scenarios Comparison sheet that includes input and output variables presented as a bubble chart. Scenarios are used as observation objects, variables are used as metrics. The characteristic feature of this bubble chart is that movement trajectory is drawn for each bubble. For example:

See also: