 Manage a set of available views
Tool interfaces in the web application and in the desktop application are identical, and differences in functionality are given in appropiate commments.
View is the method of displaying time series data.
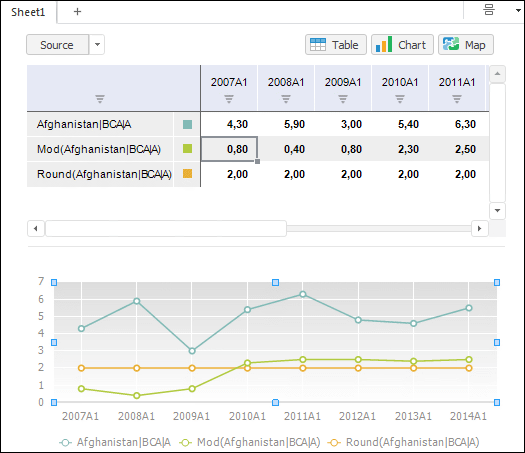
A workbook contains the following views:
Table. Table form of data presentation.
Chart. Graphic form of data presentation.
Map. Map form of data presentation.
 Manage a set of available views
The example of the workbook containing table and graphic data views:

See also: