 To apply the method
Tool interfaces in the web application and in the desktop application are identical, and differences in functionality are given in appropiate commments.
Interpolation is a method of calculating lower level data by processing higher level data. For example, monthly data must be distributed from quarterly data. The following interpolation methods are available in the time series analysis tool:
Interpolation by time (uniform). Disaggregates data using the uniform interpolation method.
Interpolation by time (repeat). Disaggregates data by repeating values of the source series frequency.
Methods are included in the Aggregation group.
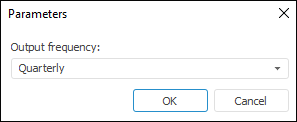
After application of the method, the Parameters dialog box opens, which is used to select input frequency.
Frequency can be output if it is less than the frequency of the time series, for which the method is applied. For example, interpolation is calculated for a series that has quarterly frequency. Thus, the Output Frequency drop-down list contains Daily and Monthly options.

Specify output frequency of the calculated series. A corresponding message appears if there are no frequencies that can be used as output frequency.
After selecting the output frequency in the workbook based on each selected series the calculated series with a name of the <Function_Name>(<Series_Name>) type will be created, containing the calculation results. For example:

To change the interpolation calculation method, use the Parameters side panel tab.

Select the required interpolation by time calculation method in the Method drop-down list.
See also:
Working with Calculated Series | Interpolation Methods Modeling ContainerInterpolation | IModelling.Interpolate | IModelling.InterpolateP