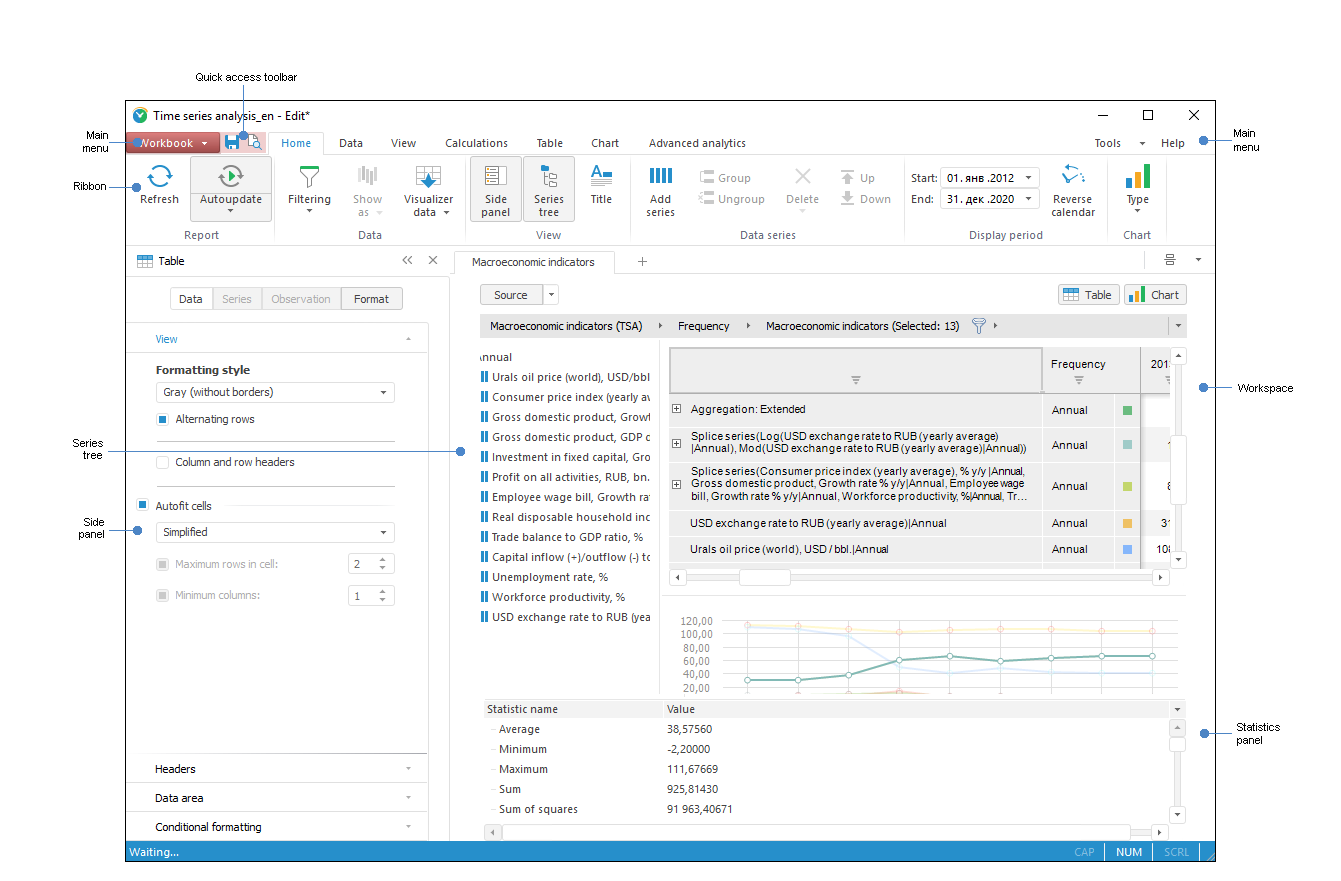
Tool interfaces in the web application and in the desktop application are identical, and differences in functionality are given in appropiate commments.
Time series analysis tool main window:

The window contains:
Main menu. Contains basic commands for working with a time series database. The main menu consists of the submenus:
Workbook. It is used to execute operations with time series database workbooks.
Tools. It is used to set up parameters of the Time Series Analysis tool.
Help. It is used to work with Foresight Analytics Platform help system.
Ribbon. It contains commands located on tabs and logically grouped. Each tab is related with the type of operation, for example, working with data table or calculated series.
To get information about rules and features of working with ribbon, see the Setting Up Ribbon section.
Side panel. It contains tabs that are used to set up time series analysis parameters. The tabs are combined into the groups: Data, Series, Observation, Format, Selection, Equation. To display the required group, use the radio buttons in the upper part of the panel. A set of tabs in the group depends on the object type. The object's name and icon are displayed in the upper part of the panel.
To get information about rules and features of working with the side panel, see the Setting Up Side Panel section.
TIP. Enable automatic refresh mode to immediately show results of changing object parameters in the workbook. To do this, click the ![]() Refresh Automatically button on the View ribbon tab.
Refresh Automatically button on the View ribbon tab.
Workbook. The main functional area of the time series database that is used to work with time data series.
See also: