Setting Up Data Visualization
When working with information panels in the edit mode, to set up data visualizers, use the control panel and side panel.
Control Panel
The control panel is used to work with dimensions and facts of visualizers and to set up their fields.

 Dimensions button. The control panel is displayed by default.
 Dimensions button.
The control panel contains the groups:
Dimensions. It contains visualizer data source fields:
Fields of data model, which types are not integer or real numbers.
All dimensions of standard cube.
Facts. It contains integer and real type fields of data model, calculated facts, and calculated fields.
Available operations with facts: fact search and working with calculated facts.
Fields. It is used to set up the fields required for building visualizers.
Available operations with fields: setting fields, changing field role, setting up dimension filter, setting up level aggregation, setting up fact aggregation, setting up data format and deleting fields.
Dimension Filter. It is used to set up dimension filter.
NOTE. When the Dimension Filter group is displayed, the Dimensions and Facts groups are hidden.
Filter on Condition. It is used to set a filtering condition for a column with data.

The Dimensions group is displayed if information panel's data source is a data model or table data set.
Operations with Facts
 Search button in the Facts group and start typing name of the required fact.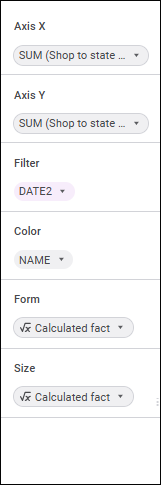
Setting up fields is available only for selected visualizer.
Setting Fields
To set fields, use dimensions and facts from corresponding groups. When setting visualizer fields, one can use facts several times. Various aggregation and role field settings can be set for such fields.

 Up and
  Down items in the drop-down menu of the
  Actions button.


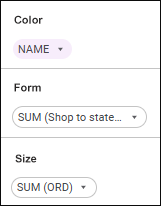
 Set point color, form, and size


 Georole item in the drop-down menu of the
Operations with Fields
 Level Aggregation item in the drop-down menu of the

 and
and  buttons. The number of decimal places is displayed as in the source by default.
 Delete item in the drop-down menu of the
  Actions button.
 Set Up Filter item in the drop-down menu of the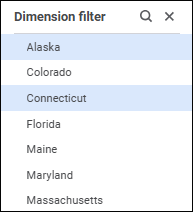
For details about working with the Dimension Filter group see the Setting Up Dimensions and Element Selection section.
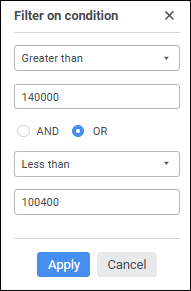
The Filter on Condition group is displayed if information panel's data source is a data model or table data set.
Set the parameters:
Selection condition. Select the condition to display elements (equal, not equal, and so on) in the drop-down list. The None value is set by default, that is, data is not filtered.
Value. Specify value of the condition to display elements in edit boxes or using the keyboard. The edit box appearance depends on field data type.
Filtering conditions. The radio button that determines the order of simultaneous use of two conditions:
AND. When the radio button is selected, the rows satisfying both conditions are displayed.
OR. When the radio button is selected, the rows satisfying at least one condition are displayed.
Click the Apply button to enable data filtering.
Side Panel
The side panel is used to set up displaying of visualizers or slides.
 Settings button on the
  Settings button on the
 The settings on the panel depend on the selected slide or type of selected visualizer:
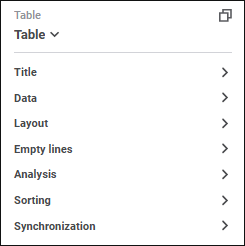
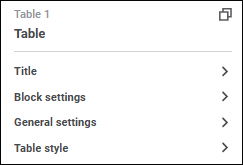
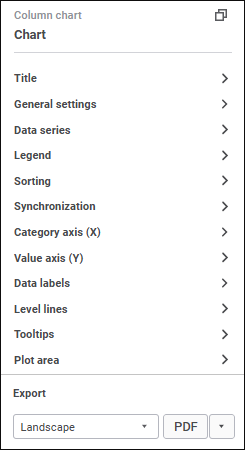
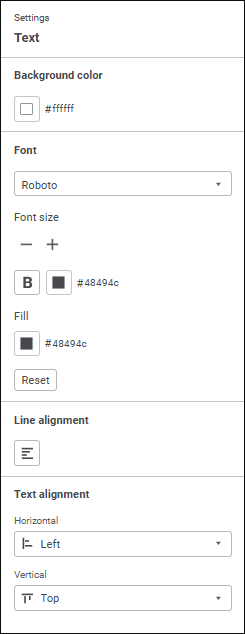
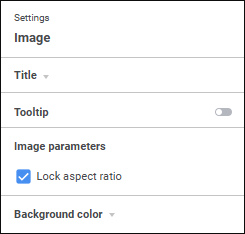
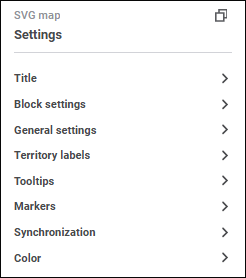
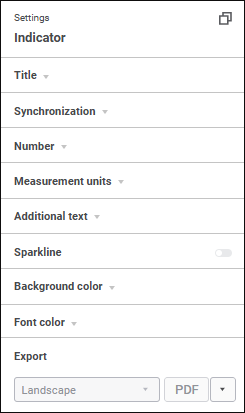
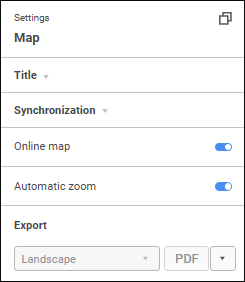
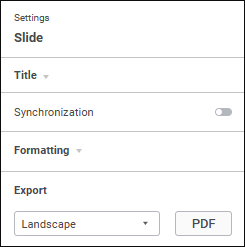
General settings available for slides and various visualizer types:
 Copy Identifier button on the
  Add Color button. The advanced color palette opens.
 . Left.
 . Center.
 . Right.

 Delete button.
Set up visualizer synchronization on slide
The settings available for various visualizer types are given in the sections:
See also:
Adding Visualizers and Working with Them | Adding Slides and Working with Them | Synchronizing Visualizers on Slide