Execute the command corresponding to plugin name in the drop-down menu of the
 Plugins button on the Home or Insert ribbon tab.
Select the New Block > Plugins > <plugin name> item in the dashboard's context menu.
Tool interfaces in the web application and in the desktop application are identical, and differences in functionality are given in appropriate comments.
Plugins are modules connected to a dashboard to enhance its functionality. For details see the Plugins section.
The web application allows for inserting preset plugins:
Sankey chart. It displays data as streams and their quantitative values in proportion to each other.
Gantt chart. It displays data as a histogram allowing to execute calendar and network scheduling.
Indicator. It displays data as single key indicators.
If it is required to extend functionality of preset plugins, change source files in the Plugins/Dashboard folder located in the folder with installed web application.
To insert a custom plugin to the web application and the desktop application:
IMPORTANT. The following identifiers are reserved for preset plugins: PP.Ui.Dashboard.Sankey - Sankey chart; PP.Ui.Dashboard.Gantt - Gantt chart; PP.Ui.Dashboard.Indicator - Indicator. When creating a custom plugin, use the identifier that is different from the reserved one.
Execute one of the operations in the dashboard:
Execute the command corresponding to plugin name in the drop-down menu of the ![]() Plugins button on the Home or Insert ribbon tab.
Plugins button on the Home or Insert ribbon tab.
Select the New Block > Plugins > <plugin name> item in the dashboard's context menu.
After executing the operations the plugin will be inserted to the dashboard as a single object. All operations with objects described in the Building Dashboard section are available for plugins. If the plugin supports work with data sources, it is also possible to select a data source for it.
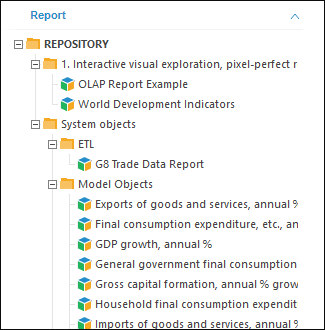
Use the Report tab on the side panel to select a data source. To display the tab:
Make sure that the side panel is displayed.
Add a new plugin or select the current one in the working area.
Go to the Report tab.
The tab displays all data sources in the repository available for the plugin. Select the corresponding element in the tree of objects to select or change the data source:

See also: