
 To open the group of tabs
Tool interfaces in the web application and in the desktop application are identical, and differences in functionality are given in appropriate comments.
Dashboards use data of one or several data sources. A data source is shown as a multidimensional data array.
A dimension is a structural unit of a multidimensional data source. As dimensions, one can use dictionaries of the repository.
A dictionary can be:
Hierarchical. Dictionary elements are arranged at different levels of hierarchy and are linked by "parent-child" relations.
Non-hierarchical. Dictionary elements are arranged at one level of hierarchy and are not linked by "parent-child" relations.
To work with data source dimensions, use the Selection tab group on the side panel.
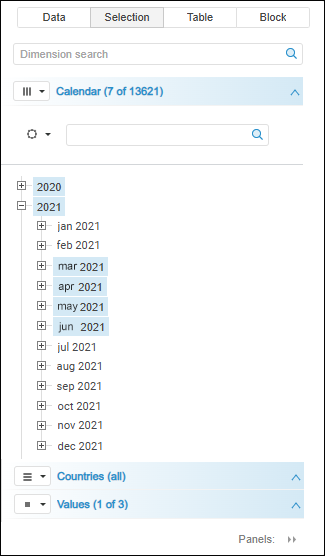
If not all tabs with dimensions fit the side panel, the  Panels button is displayed. Click this button to display the list of hidden tabs. To open the required tab, click its name.
The web application highlights the dimensions, in which at least one element is selected, with gradient fill. Gradient fill is convenient when working with a number of dimensions.
To work with dimensions, see the Working with Dimensions section.
To work with dimension elements, see the Working with Dimension Elements section.
See also:
Selecting and Setting Up Visualizer Data Source