In this article:
Viewing System Resource Volume Used by Containers
Checking Work of Pods on Each Cluster Node and Auditing Their Logs
Checking OKD Cluster Work
To execute diagnostics and eliminate system errors, open the OKD application:
Application capabilities:
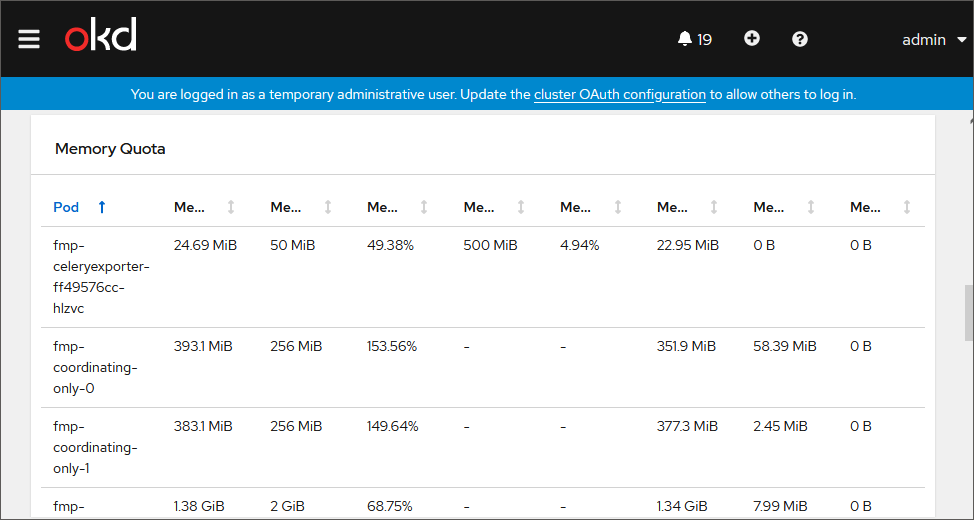
Viewing System Resource Volume Used by Containers
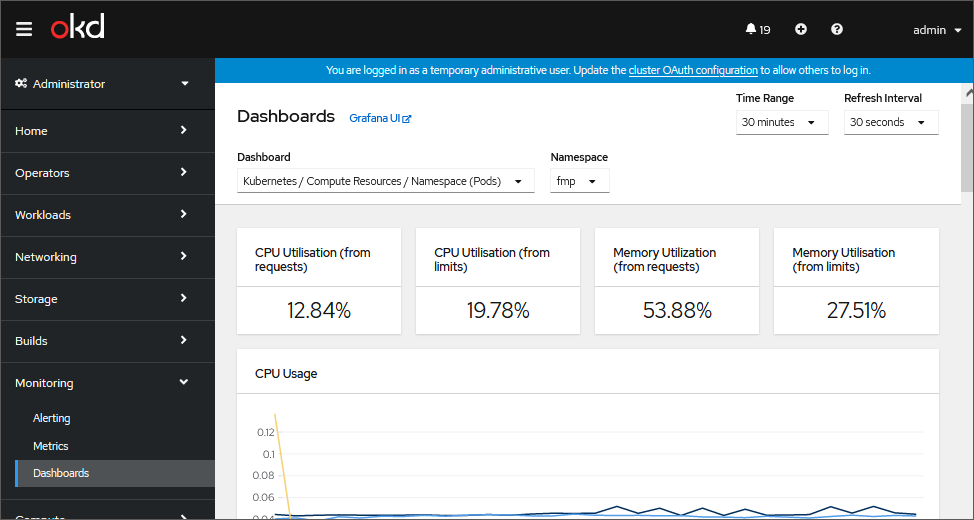
To view CPU and RAM usage by containers, open the Monitoring > Dashboards subsection and select the Kubernetes/Compute Resources/Namespace (Pods) dashboard in the Dashboards drop-down list:
By default, a chart displays statistics of system resources usage volume by all pods. To show the statistic by a specific pod, hover the cursor on the chart point. A tooltip is displayed showing a pod name and corresponding resource usage value.
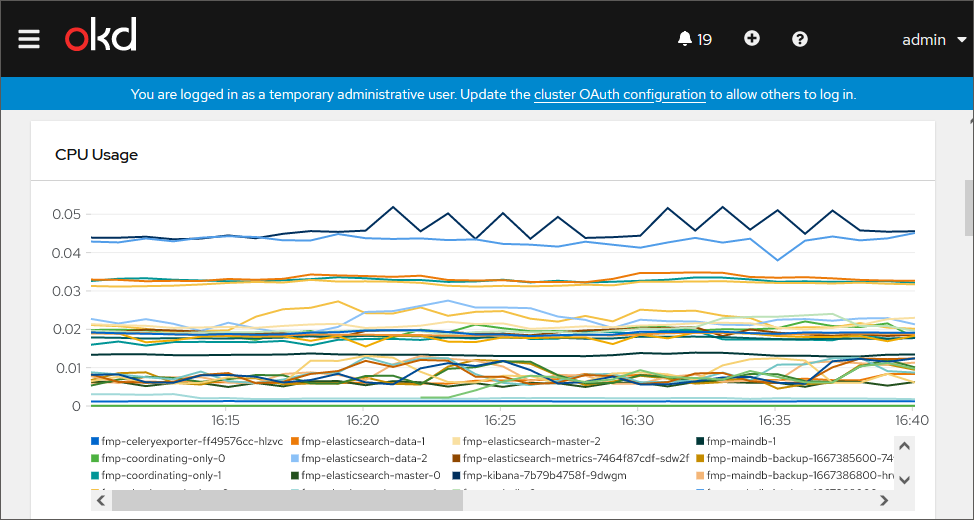
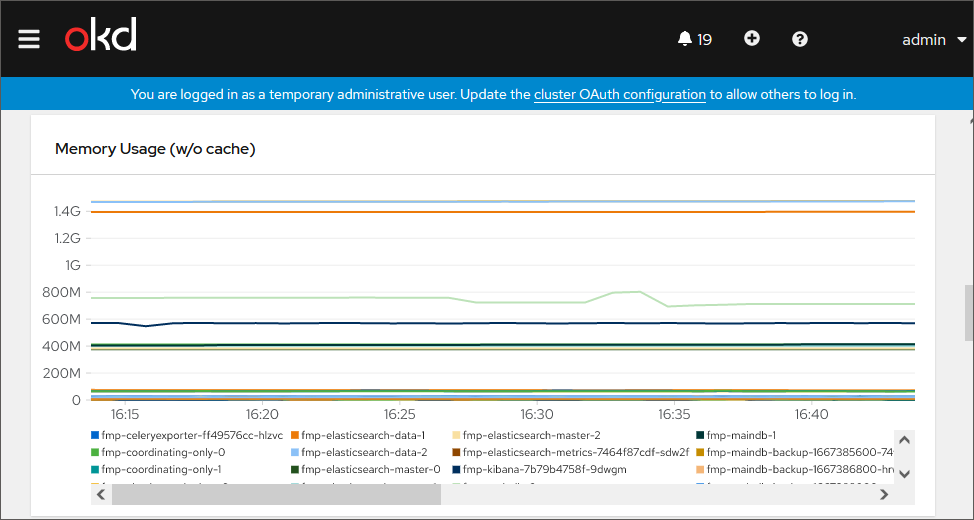
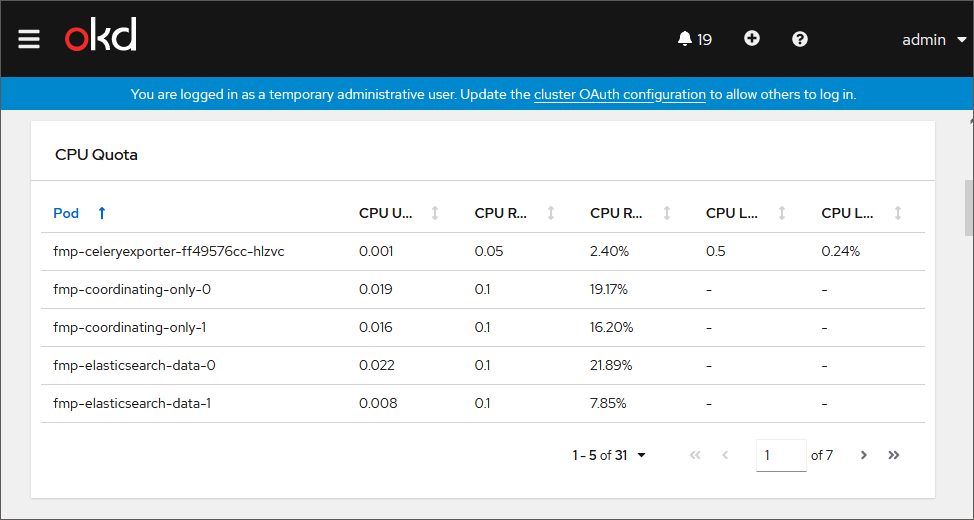
Chart examples:
CPU usage by different pods:
RAM usage by different nods:
Information about pod constraints for CPU:
Information about pod constraints for RAM:
Checking Work of Pods on Each Cluster Node and Auditing Their Logs
To check work of pods on each cluster node:
Open the Compute > Nodes subsection:
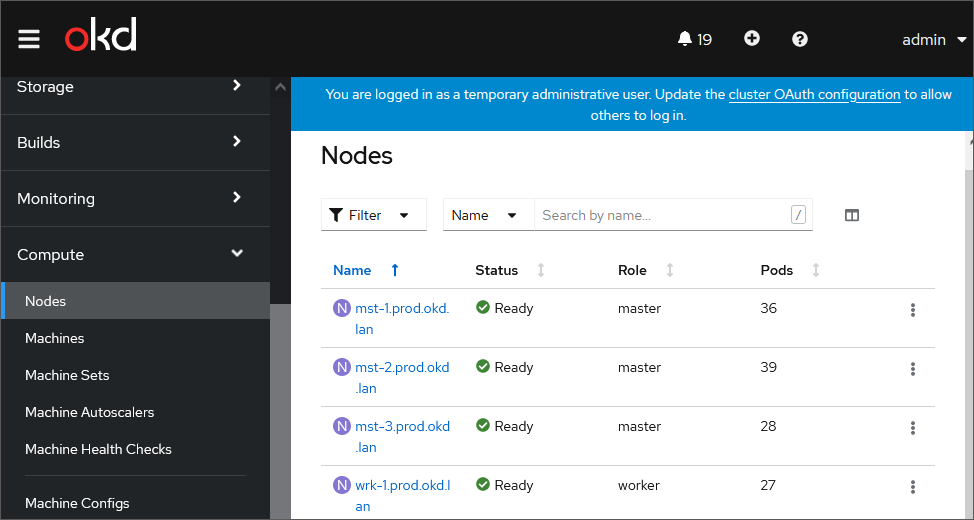
The table displays a list of cluster nodes with system characteristics.
Click the cluster node name in the Name column to view detailed data about a specific cluster node.
Go to the Pods tab:
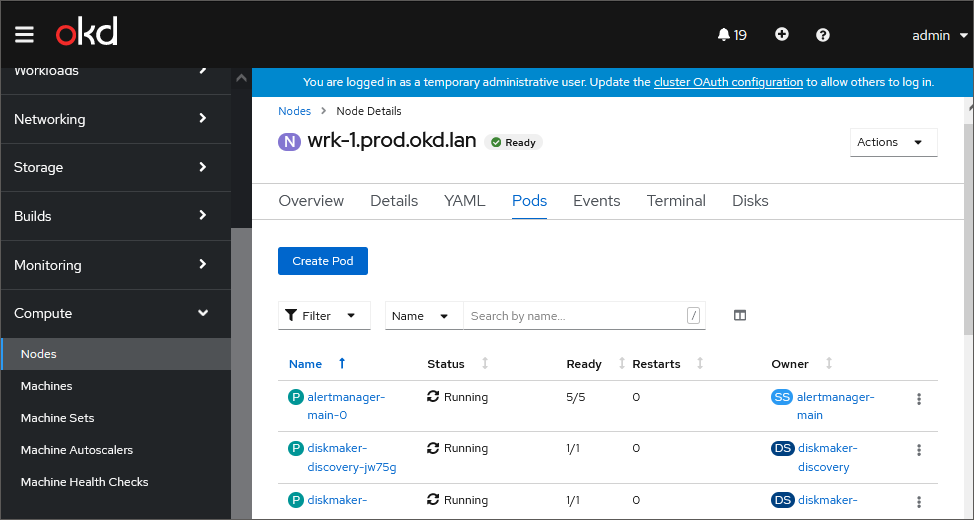
The tab displays a table with a list of pods.
Analyze the work of pods by parameters (columns):
Status. The current pod status:
Running. Execution of processes.
Completed. Processes are completed.
Error. Error
Pending. Waiting.
Ready. The number of running containers in the format: <number of running containers>/<total number of containers>.
Pod work is considered incorrect:
If the pod status is Running but not all containers are running.
If the pod status is Error or Pending.
Restart the pod in case of incorrect work.
If incorrect behavior persists after the pod restart, audit pod logs.
To audit pod logs on the Pods tab:
Click the pod name in the Name column to view detailed data about a specific pod.
TIP. It is recommended to check the following pods: fmp-api, fmp-auth, fmp-dashboard, fmp-rpc, fmp-web.
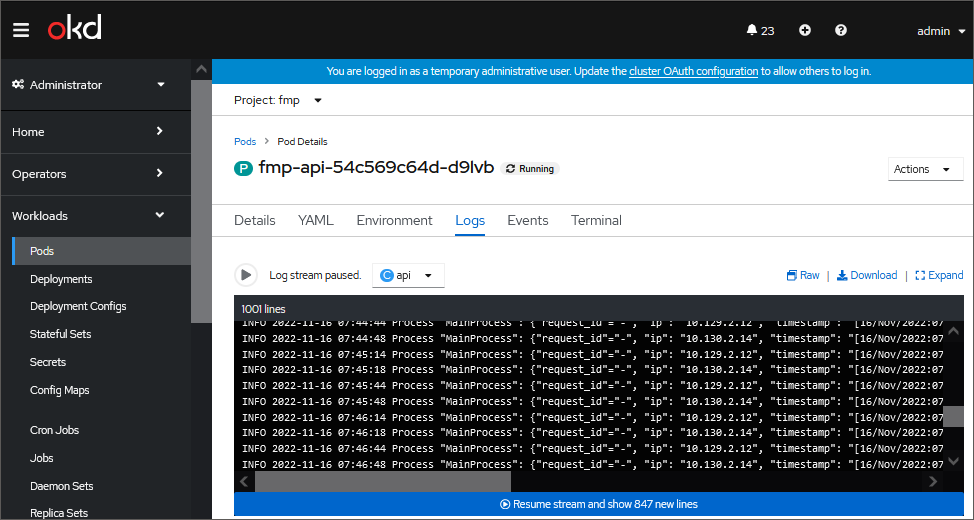
Go to the Logs tab:
Sort pod logs by execution time using the command:
kubectl logs <pod name> -n <mobile platform server namespace> | sort -k 23
After executing the operation the list of logs is displayed sorted by process execution time from the fastest to the slowest ones.
Analyze pod logs. The example of logs that indicate incorrect work of containers of the fmp-api pod (it is also actual for fmp-auth, fmp-dashboard, fmp-rpc, fmp-web):
{"request_id"="-","ip": "10.129.2.28", "timestamp": "[08/Sep/2022:10:54:06 +0000]", "http_method: "GET", "URN": "/metrics", "query_string": "", "response_status": 200, "response_length": 1948, "response_time": 0.045690}
Explanation of the example:
{"request_id"="<request identifier>", "ip": "<Client IP address>", "timestamp": "<time of sending response to client>", "http_method: "<HTTP method of request>", "URN": "<URN>", "query_string": "values of GET parameters", "response_status": <response status>, "response_length": <response length>, "response_time": <response processing time>}
The logs that are different from those in the example may indicate the incorrect pod work. If pod logs analysis did not result in finding the reason of incorrect work, check access to data source.
If a mobile platform server returns the 502 error, analyze logs of the fmp-nginx pod, which characterize the work of the nginx proxy service.
Checking Access to Data Source
To check access to data source, send the test request to mobile platform server:
From a mobile device.
Using the curl tool.
If a test request to mobile platform server is not executed, send the request to data source:
From container. Consider sending of request to data source based on the example of the rpc API method. To do this:
Open the Compute > Nodes subsection.
Select the specific cluster node, in this case it will be fmp-rpc.
Go to the Terminal tab:
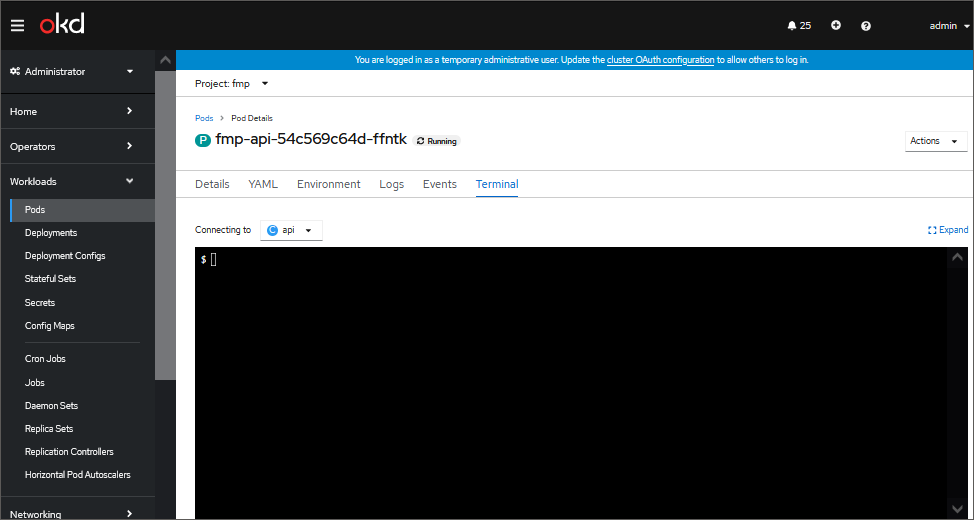
Send a request to data source and compare the result with the expected one.
From mobile platform server.
NOTE. If a request is executed only from the container, perhaps, proxy services (nginx, ingres of cluster, and so on) work incorrectly. To detect such a service, send a request to each proxy level. if the request is not executed from the container, check timeouts.
Timeouts specified on the proxy server and the framework, should correspond to the actual time of request execution. Check the set timeouts at the proxy server before the cluster, in the cluster (Ingress Controller) and in the data source. If timeouts are specified correctly, check cluster events.
Checking Cluster Events
To check and analyze cluster events, execute one of the operations:
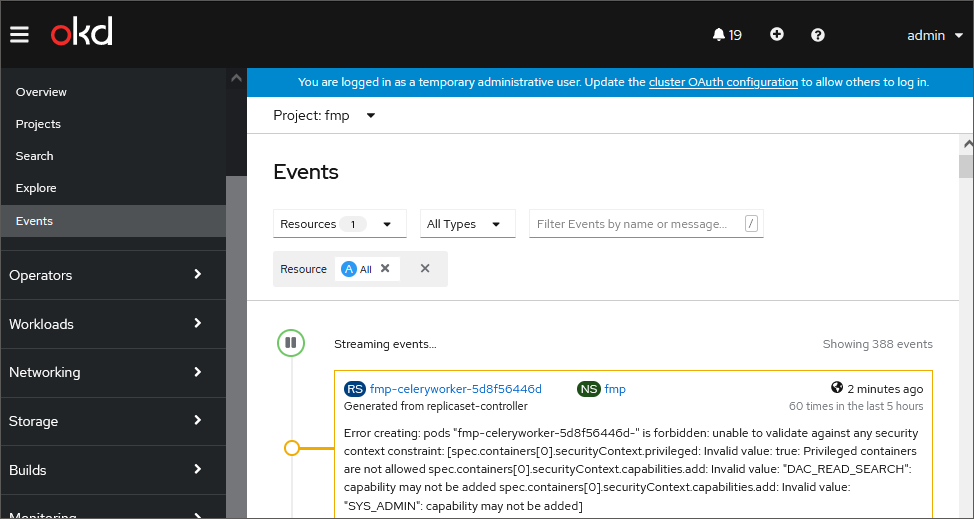
Open the Home > Events subection:
Execute the command:
kubectl get events -n <mobile platform server namespace>
After executing the operation the information about cluster events is obtained. For details about cluster events detailing, see OKD documentation.