Marker: VisualizatorSizeMarkerShape;
The Marker property determines the shape used as a marker of size legend element.
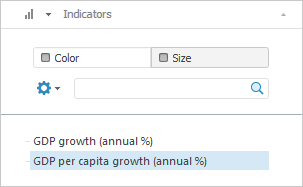
To display the size legend, set the Role metric for the dimension and select the Size radio button on the dimension's tab:

After executing the operations the size legend appears in the bubble tree:

Executing the example requires that the repository contains an express report with the EXPRESS identifier that contains a bubble tree with added size legend.
Add links to the Drawing, Express, Metabase, Visualizators system assemblies.
Sub UserProc;
Var
Metabase: IMetabase;
Analyzer: IEaxAnalyzer;
BubbleTree: IVZBubbleTree;
SizeLegend: IVZSizeLegend;
Style: IVZControlStyle;
Begin
// Get the current repository
Metabase := MetabaseClass.Active;
// Get express report
Analyzer := Metabase.ItemById("EXPRESS").Edit As IEaxAnalyzer;
// Get bubble tree
BubbleTree := Analyzer.BubbleTree.BubbleTree;
// Get size legend
SizeLegend := BubbleTree.Legends.Item(1) As IVZSizeLegend;
// Set marker
SizeLegend.Marker.Marker := VisualizatorSizeMarkerShape.Rectangle;
// Set maximum and minimum value for scale
SizeLegend.MinValue := 3.5;
SizeLegend.MaxValue := 35.7;
// Set label format for minimum and maximum value
SizeLegend.MinValueFormat := "From {0:0.00}";
SizeLegend.MaxValueFormat := "To {0:0.00}";
// Set text indention from graphic elements of legend
SizeLegend.TextSpacing := 10;
// Set style for legend labels
Style := SizeLegend.Style;
Style.FontColor := New GxColor.CreateRGB(102, 98, 227);
Style.Font := New GxFont.Create("Tahoma", 12);
// Save changes, made in express report
(Analyzer As IMetabaseObject).Save;
End Sub UserProc;
After executing the example, rectangular markers, maximum and minimum values, and formats of record for minimum and maximum values, and label indents from graphic elements of legend equal to 10 pixels, are set for bubble tree size legend:

See also: