Bubbles: IVZBubblesArray;
The Bubbles property determines an array of bubble indicators for the map layer.
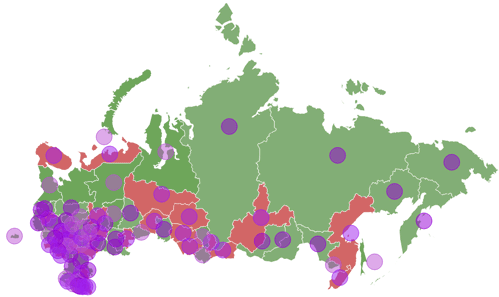
Bubble indicator enables the user to display additional information about territories, for example, correlation of indicator values.
To enable this type of indicators, use the registry setting: [HKEY_CURRENT_USER\Software\Foresight\Prognoz\10.0\Visualizers\MapChart\EnableBubbleIndicator] = 1. If the MapChart end section and the REG_DWORD parameter EnableBubbleIndicator =1 are missing in the registry, create them manually.
Working with bubble indicators is executed similarly as with pie indicators.
The example of map with bubble indicators:
Executing the example requires that the repository contains an express report with the EXPRESS identifier with a map. Facts dimension has the 10124 key.
Add links to the Dimensions, Express, Metabase, Pivot, Visualizators system assemblies.
Sub UserProc;
Var
MB: IMetabase;
Express: IEaxAnalyzer;
Map: IVZMapChart;
Facts: IDimInstance;
Slice: IEaxDataAreaSlice;
Sel: IDimSelection;
Layer: IVZMapChartLayer;
BubblesArray: IVZBubblesArray;
Bubble: IVZMapChartBubble;
Begin
// Get the current repository
MB := MetabaseClass.Active;
// Get express report
Express := MB.ItemById("EXPRESS").Edit As IEaxAnalyzer;
// Get map
Map := Express.MapChart.MapChart;
// Set fact dimension as a metrics dimension
Facts := Express.Pivot.Dimensions.FindByKey(10124).DimInstance;
Slice := Express.DataArea.Slices.Item(0);
Slice.IndicatorsDimension := Facts;
// Enable the Bubble Color metric type and add all elements to selection
Sel := Express.MapChart.IndicatorSelection(EaxMapChartIndicators.BubbleColor);
Sel.SelectAll;
// Get map layer
Layer := Map.RootLayer.SubLayers.Item(0);
// Get collection of bubble indicators
BubblesArray := Layer.Bubbles;
// Get object for working with bubble indicators
Bubble := BubblesArray.Item(0);
// Change minimum radius of bubble indicators
Bubble.LeastSizeRadius := 15.0;
// Clear collection of bubble indicators
BubblesArray.Clear;
// Add previously obtained object to work with bubble indicators
BubblesArray.Add(Bubble);
// Refresh and save report
Express.RefreshAll;
(Express As IMetabaseObject).Save;
End Sub UserProc;
After executing the example, bubble indicators are displayed on the express report map. The minimum radius 15 will be set for bubble indicators.
See also: