SeriesFormatted: Boolean;
The SeriesFormatted property determines whether formatted cell text will be used for chart series names.
The formatted text is understood as data display format (ITabRange.FormattedText).
Available values:
True. Formatted text in cells is used on forming chart rows names.
False. Unformatted text is used.
Executing the example requires a regular report with the REPORT identifier with a chart on the report sheet.
Add links to the Metabase, Report and Tab system assemblies.
Sub UserProc;
Var
mb: IMetabase;
Report: IPrxReport;
Tab: ITabSheet;
Chart: IPrxChart;
Begin
mb := MetabaseClass.Active;
Report := mb.ItemById("REPORT").Edit As IPrxReport;
Tab := (Report.ActiveSheet As IPrxTable).TabSheet;
Chart := Tab.Objects.Item(0).Extension As IPrxChart;
Chart.SeriesFormatted := True;
Chart.PointsFormatted := True;
(Report As IMetabaseObject).Save;
End Sub UserProc;
After executing the example the regular report chart is available to work with the enabled option of cell text formatting for rows names and chart points names.
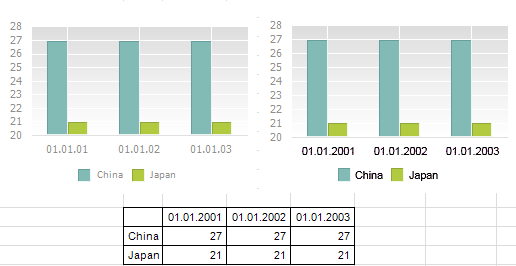
Below is a data area, for rows and points names of which text formatting is applied.
See below examples of a chart for a data area with this option disabled (left) and enabled (right):

See also: