PP.MapBubble(settings);
settings. JSON object that contains values of class properties.
The MapBubble constructor creates an instance of the MapBubble class.
To execute the example the HTML page must contain the MapChart component named map (see Example of Creating the MapChart Component). Create a bubble factor for a map layer area with the RU-KYA identifier and show a tooltip for it:
// Returns layer with map areas
function getWorkLayer() {
    return map.getLayer("Regions");
}
// Returns the current dimension selection for map axis
function getTimelineIndex() {
    return 1;
}
// Returns basic class of map bubble factor
function getBubbleVisual() {
    return map.getVisuals().bubbleVisual0;
}
// Returns map layer area with the specified identifier
function getShape(shapeId) {
    var shape = getWorkLayer().getParentLayer().getShape(shapeId);
    map.setBubbleHoverness(shape);
    return shape;
}
// Creates a tooltip
function createToolTip() {
    var toolTip = new PP.Ui.ChartTooltipBase({
        HoverMode: PP.HoverMode.Click,
        MaskText: {
            IsAuto: true,
            Value: "{%Name}"
        }
    });
    toolTip.setFont(new PP.Font({
        Color: PP.Color.Colors.white
    }));
    return toolTip;
}
// Renders tooltip
function drawToolTip(mapBubble) {
    // Determine tooltip fill color
    mapBubble.getToolTip().setBackground(new PP.SolidColorBrush({
        Color: mapBubble.getToolTipColor(),
        Opacity: 0.5
    }));
    // Dete3rmine tooltip border for bubble factor
    mapBubble.getToolTip().setBorder(new PP.Border({
        Color: mapBubble.getChart().getToolTipColor(mapBubble, PP.Color.Colors.darkblue),
        Width: 2,
        Radius: 3
    }));
    /* Use custom border color
    for bubble factor tooltip*/
    mapBubble.getChart().setUseItemColorForToolTipBorder(false);
    // Display tooltip
    mapBubble.toggleToolTip();
}
// Creates a bubble factor
function createMapBubble() {
    // Create a bubble factor
    var mapBubble = new PP.MapBubble({
        Chart: map,
        Shape: getShape("RU-KYA"),
        Visual: getBubbleVisual(),
        Layer: getWorkLayer(), // Map layer
        LeastSizePart: 30, // Minimum diameter of a bubble
        ToolTip: createToolTip(), // Tooltip
    });
    // Refreshes bubble factor
    mapBubble.refresh = function() {
        // Remove bubble factor from map layer
        clearMapBubble(this);
        // Check if there are several data mappings
        if (!mapBubble.isMeta()) {
            this._isDrawed = false;
        }
        // Rerender bubble factor
        this.draw();
        // Display bubble factor
        this.renderFrame(this.getChart().getBubbleLayer())
    };
    return mapBubble;
}
// Removes bubble factor from map layer
function clearMapBubble(mapBubble) {
    mapBubble.clear();
    mapBubble.getChart().getBubbleLayer().clear();
}
// Renders bubble factor
function drawMapBubble(mapBubble) {
    mapBubble.setSelectedIndex(getTimelineIndex());
    mapBubble.getLayer().getMapBubbleCollection().push(mapBubble);
    // Render bubble factor
    mapBubble.draw();
    // Set factor position
    var shapeCenter = mapBubble.getShape().getCenter()
    mapBubble.updatePosition(shapeCenter.getX(), shapeCenter.getY());
    // Rerender map layer
    getWorkLayer().renderFrame();
}
// Outputs information displayed in a tooltip
function printToolTipInfo(mapBubble) {
    // Set bubble factor
    var bubble1 = {};
    var bubbleKey = "mapBubble";
    bubble1[bubbleKey] = mapBubble.getSettings();
    getWorkLayer().setBubbles(bubble1);
    var bubble2 = getWorkLayer().getBubbles()["mapBubble"];
    console.log("Tooltip displays data for the "%s" region for %s year",
        bubble2.getShapeId(), bubble2.getToolTipValues().TimelineStep);
    }
// Create a bubble factor
var mapBubble = createMapBubble();
// Render this factor
drawMapBubble(mapBubble);
// Display tooltip
drawToolTip(mapBubble);
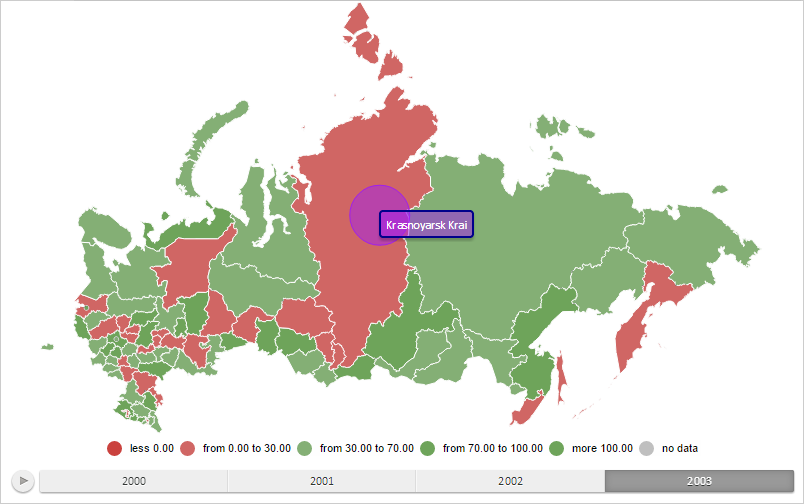
After executing the example, a bubble factor for the map layer area with the RU-KYA ID and a tooltip for the ID were shown.
Determine the region and the year for which data is shown in the tooltip:
printToolTipInfo(mapBubble);
After executing the example, the browser console displays the region ID and the year for which data is shown in the tooltip:
Tooltip shows data for the RU-KYA region for 2003
See also: