Working with Graphic Elements > Components > DataGrid > Example of Creating the DataGrid Component
To execute the example, create an HTML page and perform the following operations:
1. Add a link to the PP.css and PP.DataGrid.css. files. Also add links to the following JS files:
PP.js;
PP.DataGrid.js.
2. In the <body> tag place a block with the dataGrid identifier and add a link to the script for creating a synchronous data table:
<body>
    <div id="dataGrid"></div>
    <script src="synchDataSource.js" type="text/javascript"></script>
</body>
3. Create the synchDataSource.js script file:
(function () {
    // Fill table rows
    function createRows() {
        var rows = [];
        var countries = ["Russia", "Poland", "Austria", "Germany", "Norway",
            "Netherlands", "Sweden", "Switzerland", "Portugal", "France"];
        var popul = [143, 38, 8, 80, 5, 17, 9, 8, 10, 65];
        var ids = ["ru", "pl", "au", "de", "no", "nl", "se", "ch", "pt", "fr", ];
        for (var i = 0; i < 10; i++) {
            rows.push({
                "@I": i,
                "Cells": {
                    "num": {
                        "@SI": "2",
                        "CellData": {
                            "@V": i,
                            "@FT": i + ''
                        }
                    },
                    "country": {
                        "@SI": "2",
                        "CellData": {
                            "@V": countries[i],
                            "@FT": countries[i]
                        }
                    },
                    "popul": {
                        "@SI": "2",
                        "CellData": {
                            "@V": popul[i],
                            "@FT": popul[i]
                        }
                    },
                    "id": {
                        "@SI": "0",
                        "CellData": {
                            "@V": ids[i],
                            "@FT": ids[i]
                        }
                    }
                }
            });
        }
        return rows;
    }
    // Initializes table rows
    function initData() {
        var initData = {
            Rows: {
                Row: createRows()
            }
        };
        return initData;
    }
    // Initializes table dimensions
    function initMeasures() {
        var measures = {
            "@Version": "1",
            "Structure": {
                "@FH": false, // _IsFixedHeader
                "@DRB": "true", // _IsNeedToDrawBorders
                "DefaultRow": {
                    "@H": "20"
                },
                "DefaultColumn": {
                    "@W": "70",
                    "@H": "40"
                },
                "Rows": {
                    "Row": []
                },
                "Columns": {
                    "Column": [{
                        Title: '№', // Required
                        Width: '20',
                        IsVisible: true,
                        IsBand: false,
                        Enabled: true,
                        EnableColumnResize: true,
                        EnableColumnMove: true,
                        EnableSort: true,
Name: "num",  // Required
                        StyleIndex: 2,
                        CellType: 'num',
                        RenderEditor: false,
                    }, {
                        Title: Country', // Required
                        Width: '80',
                        IsVisible: true,
                IsBand: false,
Enabled: true,
EnableColumnResize: true,
EnableColumnMove: true,
EnableSort: true,
Name: "country", // Required
StyleIndex: 2,
CellType: 'string'
}, {
Title: Population, mln people', // Required
Width: '80',
IsVisible: true,
IsBand: false,
Enabled: false,
EnableColumnResize: true,
EnableColumnMove: true,
EnableSort: true,
Name: "popul", // Required
Editor: {
PPType: "PP.Ui.NumberEdit",
MaxValue: 1000,
MinValue: 0
},
StyleIndex: 2,
CellType: 'num',
}, {
Title: Identifier', // Required
Width: '90',
IsVisible: true,
AutoSize: false,
IsBand: false,
Enabled: true,
EnableColumnResize: true,
EnableColumnMove: true,
EnableSort: true,
Name: "id", // Required
StyleIndex: 2,
RenderEditor: false,
CellType: 'string',
}]
}
},
"Styles": {
"Style": []
}
};
return measures;
}
// Creates a data source
function createDataSource() {
var dataSource = new PP.Ui.DGDataSource({
DefaultRowHeight: 30,
Measures: initMeasures(),
Data: initData()
});
return dataSource;
}
// Creates a data table
function createDataGrid() {
var grid = new PP.Ui.DataGrid({
DataLoaded: function(sender, args) {
// Process data load event
var loadDataEventData = args.getData();
if(loadDataEventData.Rows.Row) {
console.log("%s data series are loaded to table", loadDataEventData.Rows.Row.length);
}
},
Height: 280,
ParentNode: document.getElementById('dataGrid'),
DataSource: createDataSource(),
ScrollType: PP.Ui.DataGridScrollType.ByRow,
ImagePath: "../../build/img/",
RowsToBuffer: 10,
Width: 280
});
return grid;
}
// Create a data table
grid = createDataGrid();
})();
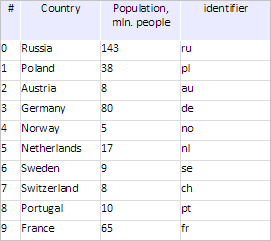
After executing the example a table with synchronously loaded data is placed to the HTML page:
The browser console displays information about the number of loaded data series:
10 data series are loaded to table
See also:
