setTotals(report: PP.Exp.EaxDocument, metadata: Object, callback: PP.Delegate);
report. Express report document.
metadata. Settings used to display totals in the table. This parameter is a JSON object that may contain nested objects columnTypes and rowTypes with the field "t" (array of aggregate functions represented by elements of the PP.Exp.Ui.TotalsEnum enumeration).
callback. Callback function.
The setTotals method sets options for showing total data in express report table.
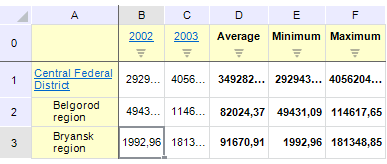
Executing the example requires that the HTML page contains the ExpressBox component named expressBox (see Example of Creating the ExpressBox Component) and have a loaded table in express report working area. Show column totals in the table:
// Get a service used to work with express report
var eaxMdService = expressBox.getService();
// Get express report document
var eaxAnalyzer = expressBox.getSource();
// Determine metadata
var metadata = {
    columnTypes: {
        // Display average, maximum and minimum value by columns
        t: [PP.Exp.Ui.TotalsEnum.Avg, PP.Exp.Ui.TotalsEnum.Min, PP.Exp.Ui.TotalsEnum.Max]
    },
    rowTypes: {
        t: PP.Exp.Ui.TotalsEnum.None
    }
};
// Determine arguments for callback function
var args = new PP.Mb.Ui.PropertyChangedEventArgs({
    PropertyName: PP.Exp.Ui.ControlType.Totals,
    Metadata: metadata,
    TypeUpdateData: [PP.Exp.Ui.ViewTypeUpdate.DataView, PP.Exp.Ui.ViewTypeUpdate.PropertyBar, PP.Exp.Ui.ViewTypeUpdate.Ribbon]
});
// Determine callback function
var onPanelChanged = function (n, t) {
    var chartView = expressBox.getDataView().getChartView();
    t ? (chartView.DataChanged.fire(chartView, t.Args), t.Args.fireCallback(n, t)) : chartView.DataChanged.fire(chartView, t);
};
// Display totals
eaxMbService.setTotals(eaxAnalyzer, metadata, PP.Delegate(this.onPanelChanged, eaxMdService, args));
// Refresh express report
expressBox.refreshAll();
After executing the example column totals are shown in the table:

See also: