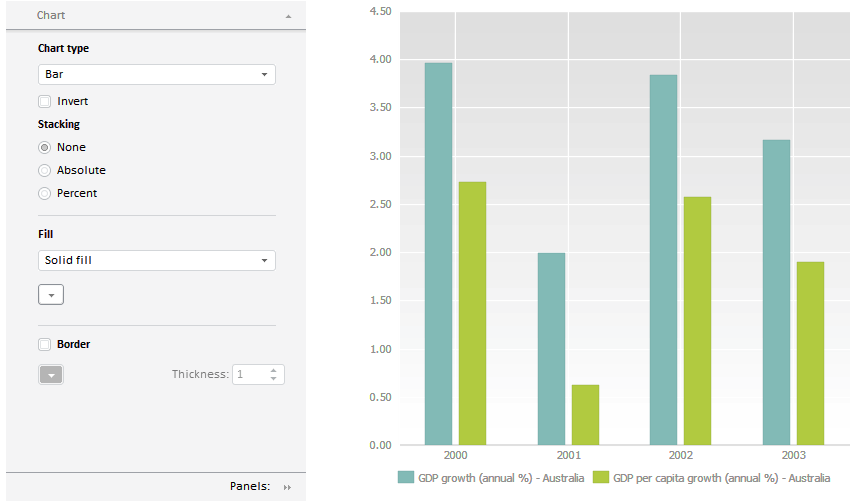
To execute the example, create an HTML page and execute the following operations:
1. Add references to the following JS and CSS files in the HEAD tag:
PP.css.
PP.Express.css.
PP.Metabase.css.
PP.js.
PP.ChartMaster.js.
PP.MapMaster.js.
PP.MapChart.js.
PP.TabSheet.js.
PP.Metabase.js.
PP.Navigator.js.
PP.Express.js.
jquery.js.
resources.ru.js.
2. Within the SCRIPT tag add a script for creation of the ChartBox and ChartMaster components:
<script type="text/javascript">
    var eaxData;
    var idTime;
    onReady = function () {
        var IMAGE_PATH = "../../build/img/"; //path to mages folder
        PP.resourceManager.setRootResourcesFolder("../resources/"); //path to resources folder
        PP.setCurrentCulture(PP.Cultures.ru); //select language settings
        var eaxAnalyzer, eaxMbService; //create the Waiter component to wait to repository connection
        waiter = new PP.Ui.Waiter();
        //Create a repository instance
        metabase = new PP.Mb.Metabase({
            Id: "WAREHOUSE",
            UserCreds: {
                UserName: "user",
                Password: "password"
            },
            StartRequest: function () {
                waiter.show();
            },
            EndRequest: function () {
                waiter.hide();
            },
            Error: function (sender, args) {
                alert(args.ResponseText);
            }
        });
        //Open repository
        metabase.open(); // Create a service for working with express reports
        eaxMbService = new PP.Exp.EaxMdService({
            Metabase: metabase
        });
        //Open express report with the 935529 key for edit
        eaxAnalyzer = eaxMbService.edit(935529);
        //Create a chart container
        chartBox = new PP.Exp.Ui.ChartBox({
            Source: eaxAnalyzer, // Data source
            Width: 500,
            Height: 500,
            ParentNode: "tdChart",
            Service: eaxMbService,
            EditMode: "None",
            SelectionEnabled: true
        });
        //Create a chart wizard
        master = new PP.Ui.ChartMaster({
            ParentNode: "chartM", //DOM node, in which chart wizard will be located
            Height: 500,
            Width: 300,
            ImagePath: IMAGE_PATH,
            DataView: chartBox
        });
        // Unsupported chart data types will not be displayed
        master.getItem(PP.Ui.ChartCommon).setShowUnsupportedTypes(false);
        // Refresh control on the Tooltips tab
        master.getItem(PP.Ui.ChartTooltipCommon).refreshHeaderControl();
    }
</script>
3. In the BODY tag place the created components:
<body onselectstart="return false" class="PPNoSelect" onload="onReady()">
    <table style="width: 100%">
        <tr>
            <td valign="top" width="350" id="chartM">
            </td>
            <td valign="top" id="tdChart">
            </td>
        </tr>
    </table>
</body>
After executing the example the express report chart and the chart setup wizard are placed on the page:

See also: