RangeMaxLabel: PP.Ui.ChartSVGLabel;
The RangeMaxLabel property determines axis label for maximum value of the filtering range.
Use JSON or the setRangeMaxLabel method to set the property value, and the getRangeMaxLabel method to get the property value.
Executing the example requires the ParallelCoordinates component named coord (see Example of Creating the ParallelCoordinates Component). Set minimum and maximum values of filtering range for the chart second axis, set masks for corresponding axis labels and a new caption:
// Get the second axis
var axis2 = coord.getAxes()[1];
// Set minimum and maximum values of filtering range
axis2.setRangeMinValue(30);
axis2.setRangeMaxValue(350);
/* Set masks for labels
for minimum and maximum values of the filtering range */
var minLabel = { MaskText: "Minimum value: {%Value:#,##.00}"};
axis2.setRangeMinLabel(minLabel);
var maxLabel = { MaskText: "Maximum value: {%Value:#,##.00}"};
axis2.setRangeMaxLabel(maxLabel);
// Set position of the labels
var x = Math.round(axis2.getX());
var minY = Math.round(axis2.getRangeMinValue());
var maxY = Math.round(axis2.getRangeMaxValue() -
axis2.getRangeMaxLabel().getRealHeight());
axis2.getRangeMinLabel().setPosition(x, minY);
axis2.getRangeMaxLabel().setPosition(x, maxY);
// Set axis caption
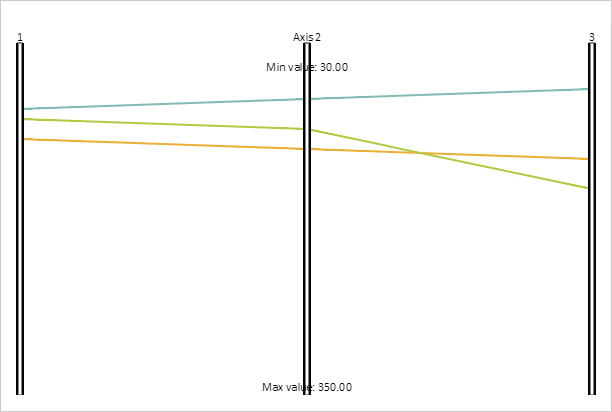
axis2.setHeader({ Text: "Axis 2" });
axis2.getHeader().setPosition(Math.round(x), 0);
// Redraw the axis
axis2.draw();
After executing the example minimum and maximum values of the filtering range are set for the chart second axis, masks are defined for corresponding axis labels, and a new axis caption is set:
See also: