
 Contents of the DataSource.js file
To execute the example, the HTML page must contain links to script files named PP.js, PP.GraphicsBase.js, PP.ParallelCoordinates.js, and DataSource.js and the styles file namedPP.css, the <div> element with the "area" identifier must be available within the <body> tag of the HTML page. The DataSource.js file determines the variable named dataSource that contains the data source for the component.
Contents of the DataSource.js file
In the onload event of the <body> tag specify invoking the createParallel() function. Create the ParallelCoordinates component:
function createParallel() {
    // Create chart axis
    var axes = [];
    for (var i = 1; i <= 3; i++) {
        // Create object for data mapping from the source with chart items
        var mapping = new PP.DataMapping({
            DataSource: dataSource,
            DimAttributeId: "id" + i,
            Type: "None",
        });
        axes.push(new PP.Ui.PCAxis({
Mapping: mapping,
// Determine width of filtering range
RangeThickness: 4,
// Determine width of the main axis line
BaseThickness: 8,
// Determine outline color of filtering range
RangeStroke: "#0B0B0B",
// Determine outline width of filtering range
RangeStrokeThickness: 1,
}));
}
// Create chart
var coord = new PP.Ui.ParallelCoordinates({
// Determine parent element
ParentNode: document.getElementById("area"),
// Determine axis
Axes: axes,
// Determine data source
DataSources: [dataSource],
// Determine size
Width: 600,
Height: 400
});
}
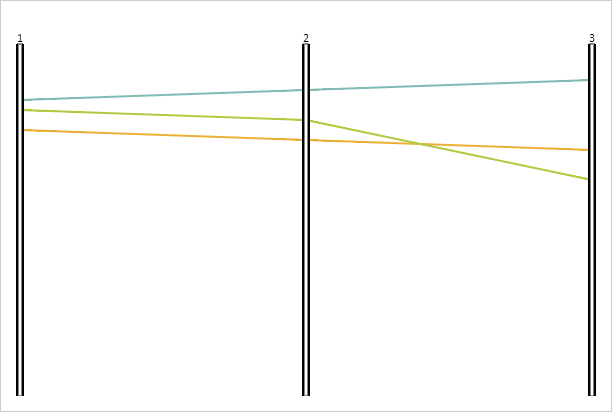
After executing the example the parallel coordinates chart is displayed:
See also: