activateResizer(coords: Object);
coords. Object that contains coordinates where the resizer is enabled. This object must contain the X and Y fields.
The activateResizer method enables resizer of the axis filtering range.
Executing the example requires the ParallelCoordinates component named coord (see Example of Creating the ParallelCoordinates Component). Create a new data transformer and a new object for data mapping. Set a new object for mapping of the second axis data:
// Enable chart filtering
coord.setFiltrationEnabled(true);
// Create function which will be applied to lines out of filtering range
var filter = new PP.Object({});
filter.apply = function (color) {
    color.setR(125);
    color.setG(125);
    color.setB(125);
};
coord.setFilterInactiveEffects([filter]);
// Create data transformer
PP.MyTransformer = function (settings) {
    PP.MyTransformer.base.constructor.apply(this, arguments);
};
PP.initClass(PP.MyTransformer, PP.NormalizationTransformer, 'PP.MyTransformer', ['PP.IDataAdapter']);
var myTransP = PP.MyTransformer.prototype;
// Determine value processing methods
myTransP.getData = function (value) {
    return value;
};
myTransP.getValue = function (value) {
    return value;
};
myTransP.init = myTransP.getMinData = myTransP.getMaxData = function (data) { };
// Create object for data mapping from the source with chart elements
var newMapping = new PP.DataMapping({
    DataSource: dataSource,
    DimAttributeId: "id2",
    Type: "Transformer",
});
newMapping.setDataTransformer(new PP.MyTransformer());
coord.getAxes()[1].setMapping(newMapping);
Enable resizer for the lower bound of the second axis' filtering range and next change the range:
// Enable resizer for the lower bound of the second axis' filtering range
coord.getAxes()[1].activateResizer({
    X: 290,
    Y: 14
});
// Change the lower filtering range
coord.getAxes()[1].moveResizerTo({ Y: 80 });
Enable resizer for the upper bound of the second axis' filtering range, edit the range and refresh the chart:
// Enable resizer for the upper bound of the second axis' filtering range
coord.getAxes()[1].activateResizer({
    X: 290,
    Y: 366
});
// Change the upper filtering range
coord.getAxes()[1].moveResizerTo({ Y: 320 });
// Refresh the chart
coord.refresh();
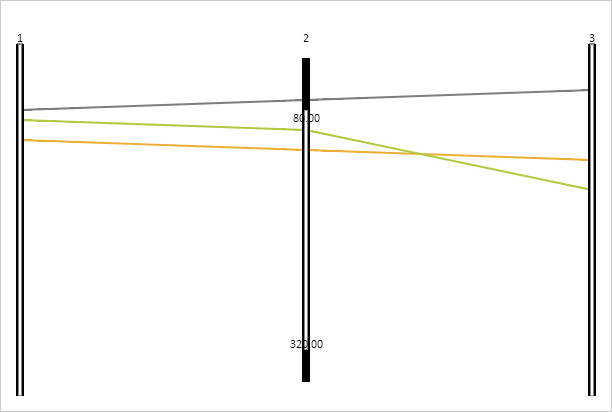
After this, the new filtering range is set for the second axis. The first line is outside of the filtering range, thus, its color changes to gray:
Shift down filtering range of the second axis:
// Shift down the filtering range
coord.getAxes()[1].moveRangeBy(5);
// Refresh the chart
coord.refresh();
After that filtering range of the second axis is shifted down:

See also: