PP.Ui.ChartText(settings);
settings. JSON object that contains values of class properties.
The ChartText constructor creates an instance of the ChartText class.
To execute the example, the HTML page must contain the Chart component named chart (see Example of Creating a Pie Chart). Add a text label to the chart. Let the label be colored in red on mouse over and in black on mouse out. Underline the label after clicking it:
// Determines if the given point is within the specified area
function isPointInArea(area, point) {
var isGreaterThanLeftBorder = (point.getX() >= area.getLeft()) ? true : false;
var isLessThanRightBorder = (point.getX() <= area.getLeft() + area.getWidth()) ? true : false;
var isGreaterThanToptBorder = (point.getY() >= area.getTop()) ? true : false;
var isLessThanBottomBorder = (point.getY() <= area.getTop() + area.getHeight()) ? true : false;
if (isGreaterThanLeftBorder & isLessThanRightBorder & isGreaterThanToptBorder & isLessThanBottomBorder) {
return true;
} else {
return false;
}
}
// Creates chart plot area
function createPlotArea() {
// Create chart plot area
var plotArea = new PP.Ui.ChartPlotArea({
Parent: chart
});
return plotArea;
}
var label;
// Creates chart text label
function createChartText(plotArea) {
// Get chart pot area context
var context = plotArea.getContext();
label = new PP.Ui.ChartText({
Font: new PP.Font(),
Left: 15,
Top: 15,
Text: "Text example",
Parent: chart.getSerie(0),
Click: function(sender, args) {
// Rerender chart plot area
plotArea.redraw();
label.getFont().setIsUnderline(!label.getFont().getIsUnderline());
label.drawSelf(context);
},
MouseOut: function(sender, args) {
// Rerender chart plot area
plotArea.redraw();
label.setColor("#000000");
label.drawSelf(context);
},
MouseOver: function(sender, args) {
// Rerender chart plot area
plotArea.redraw();
label.setColor("#FF0000");
label.drawSelf(context);
}
});
// Restore text label size
label.getSize = function() {
var size = new PP.Rect({
Left: this.getLeft(),
Top: this.getTop(),
Width: this.getWidth(),
Height: this.getHeight()
});
return size;
}
PP.Object.defineProps(PP.Ui.ChartText, ["Color", "Font"], true);
// Rerender label
label.drawSelf(context);
return label;
}
// Adds char event handlers
function defineEventsForChart() {
chart.setCustomData({
IsMouseInLabelArea: false
});
chart.addEvent(chart.getDomNode(), "mousemove", onMouseMove);
chart.addEvent(chart.getDomNode(), "click", onClicked);
}
// Handles the MouseMove event
function onMouseMove(sender, args) {
var coord = new PP.Point({
X: args.Event.x,
Y: args.Event.y
});
if (isPointInArea(label.getSize(), coord)) {
label.MouseOver.fire(this, args);
chart.getCustomData().IsMouseInLabelArea = true;
} else {
if (chart.getCustomData().IsMouseInLabelArea) {
label.MouseOut.fire(this, args);
chart.getCustomData().IsMouseInLabelArea = false;
}
}
};
// Handles the Click event
function onClicked(sender, args) {
var coord = new PP.Point({
X: args.Event.x,
Y: args.Event.y
});
if (isPointInArea(label.getSize(), coord)) {
label.Click.fire(this, args);
}
};
// Create chart plot area
var plotArea = createPlotArea();
// Create chart text label
createChartText(plotArea);
// Add chart event handlers
defineEventsForChart();
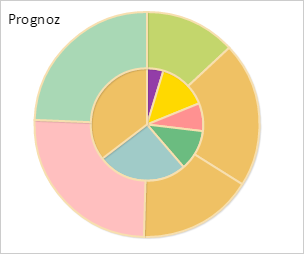
After executing the example the "Text example" text label is added to the chart:
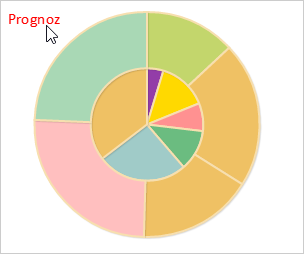
On mouseover the text label is colored in red:
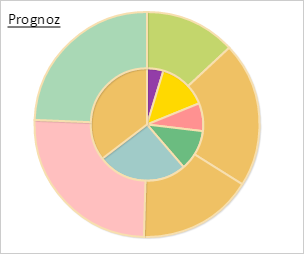
On clicking the text label is underlined:
See also: