activateSerie(serie: PP.Ui.ChartCanvasSerie);
serie. A series of points.
The activateSerie method activates a series to edit.
Executing the example requires that the HTML page contains the Chart component named chart (see Example of Creating the Chart Component). Create new edit mode and next add it to the chart:
// Create edit mode
editMode = new PP.Ui.ChartEditMode({
    Parent: chart,
    // Set edit mode
    Mode: "Point"
});
// Add edit mode to the chart
chart.getEditMode().setSettings(editMode.getSettings());
// Get the edit mode
var chartEditMode = chart.getEditMode();
Add event handlers of the series editing start and end events to the edit mode. Add handlers of mouse move and mouse click events to the document. Activate the edit mode and select the first points series to edit:
// Add handlers of chart editing events
chartEditMode.EditStarted.add(function(sender, args) {
    console.log("Chart editing has started");
});
chartEditMode.Edited.add(function(sender, args) {
    console.log("Chart editing has ended");
});
// Add handler for the page click event
document.onmousedown = function(sender, args) {
    var mc = PP.calculateMouseCoords(sender);
    var offset = PP.calculateOffset(chart.getDomNode());
    chartEditMode.handleMouseDown({
        X: mc.X - offset.X,
        Y: mc.Y - offset.Y
    }, sender);
    if (chartEditMode.getCursorOnMarker()) {
        console.log("Cursor over the marker");
    }
}
// Add event handler for the mouse movement event
document.onmousemove = function(sender, args) {
    var mc = PP.calculateMouseCoords(sender);
    var offset = PP.calculateOffset(chart.getDomNode());
    chartEditMode.handleMouseMove({
        X: mc.X - offset.X,
        Y: mc.Y - offset.Y
    }, sender);
}
// Add event handler for the mouse button releasing
document.onmouseup = function(sender, args) {
    chartEditMode.handleMouseUp({
        X: sender.x,
        Y: sender.y
    }, sender);
}
// Activate edit mode
chartEditMode.setEnabled(true);
// Activate the first series to edit
chartEditMode.activateSerie(chart.getSeries()[0]);
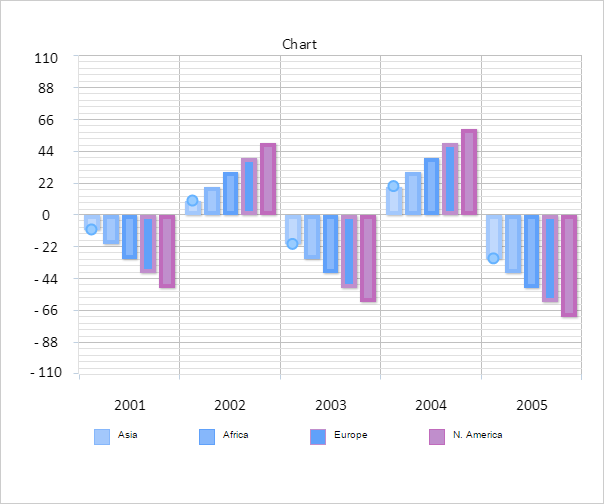
After that the chart becomes available for editing:
Stretch downward the first point of the series. The following messages are displayed to the console:
Chart editing has started
Cursor over the marker
Chart editing has ended
See also: