UseDefaultExtremes: Boolean;
The UseDefaultExtremes property indicates whether minimum and maximum axis values are used for the chart that contains no data.
Use JSON or the setUseDefaultExtremes method to set the property value, and the getUseDefaultExtremes method to get the property value.
Available values:
true. The value specified by the ChartCanvasAxis.Min property is set as the minimum for the axis of the chart containing no data, the value specified by the ChartCanvasAxis.Max property is set as the axis maximum.
false. No minimum and maximum values are set for axis of the chart containing no data (default).
Executing the example requires that the HTML page contains the Chart component named chart (see Example of Creating a Scatter Chart). Allow using minimum and maximum values for the Y axis, disable use of these values for the X axis, and next remove all data series from the chart:
// Prohibit using minimum and maximum values for X axis
chart.getXAxis().setUseDefaultExtremes(false);
// Allow using minimum and maximum values for Y axis
chart.getYAxis().setUseDefaultExtremes(true);
// Remove data series
chart.removeAllSeries(true);
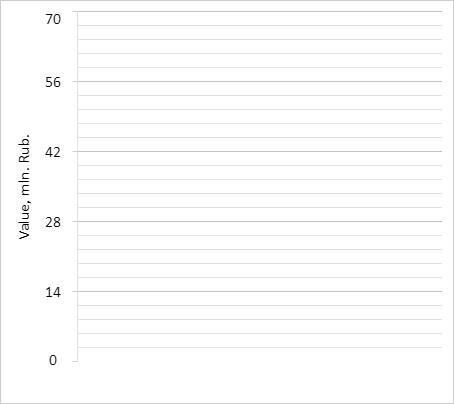
After executing the example only the Y axis with the minimum value 0 and the maximum equal to 70 is displayed after the chart series are removed:
See also: