setAxisOffset(value: Number);
value. Pixel value of the offset.
The setAxisOffset method sets chart axis offset from its start point in pixels.
Executing the example requires that the HTML page contains the Chart component named chart (see Example of Creating a Scatter Chart). Set offset equal to chart plot area width for the X axis:
// Get the X axis
var xAxis = chart.getXAxis();
// Get settings of the chart plot area
var plotBorders = xAxis.getPlotBorders();
xAxis.setAxisOffset(plotBorders.W);
// Redraw the chart
chart.redraw(true);
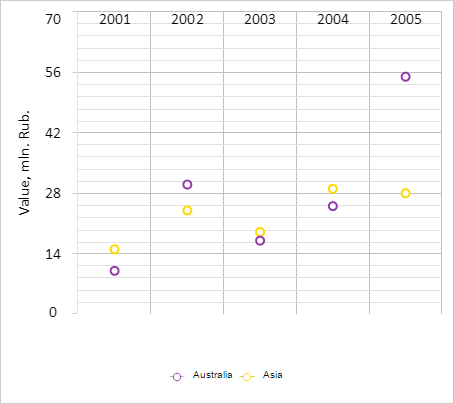
After executing the example the Y axis is moved to the top border of the chart:
See also: