PlotBands: Array;
The PlotBands property determines array that contains plot bands on the chart axis.
Use JSON to set the property value, and the getPlotBands method to get the property value.
Executing the example requires that the HTML page contains the Chart component named chart (see Example of Creating a Scatter Chart). Add two plot bands for Y axis:
// Gets color of the chart custom axis
function getPlotBandColor() {
    var plotBandColor = new PP.SolidColorBrush({
        Color: "#999",
        Opacity: 0.5
    });
    return plotBandColor;
}
// Creates the first plot band on the chart axis
function createPlotBand1(axis) {
    var plotBand1 = {
        From: axis.getRoundedMin(),
        To: axis.getDataExtremes().min,
        BackgroundColor: getPlotBandColor(),
        disableEditBand: true,
        DisableBand: true
    };
    return plotBand1;
}
// Creates the second plot band on the chart axis
function createPlotBand2(axis) {
    var plotBand2 = {
        From: axis.getRoundedMax() - 5,
        To: axis.getRoundedMax(),
        BackgroundColor: getPlotBandColor(),
        disableEditBand: true,
        DisableBand: true
    };
    return plotBand2;
}
// Get Y axis
var yAxis = chart.getYAxis();
// Calculate minimum and maximum values of the Y axis
yAxis.getSeriesExtremes();
// Get and set the first plot band on the chart axis
var plotBand1 = createPlotBand1(yAxis);
if (yAxis.getPlotBands()) {
    yAxis.getPlotBands().push(plotBand1);
}
// Get and set the second plot band on the chart axis
var plotBand2 = createPlotBand2(yAxis);
yAxis.addPlotBand(plotBand2);
// Redraw the area
chart.redraw(true);
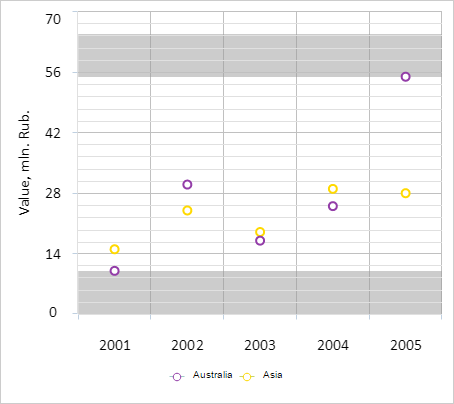
After executing the example two plot bands are created on Y axis, limiting the area that contains data series points:
Now remove the plot bands of Y axis:
// Removes plot bands of the chart axis
function removePlotBands(axis) {
        for (var i = axis.getPlotBands().length - 1; i >= 0; i--) {
            var plotBand = axis.getPlotBands()[i];
            axis.removePlotBand(plotBand);
        }
    }
    // Get Y axis on the chart
var yAxis = chart.getYAxis();
// Remove plot bands of the chart axis
removePlotBands(yAxis);
// Redraw the chart
chart.redraw(true);
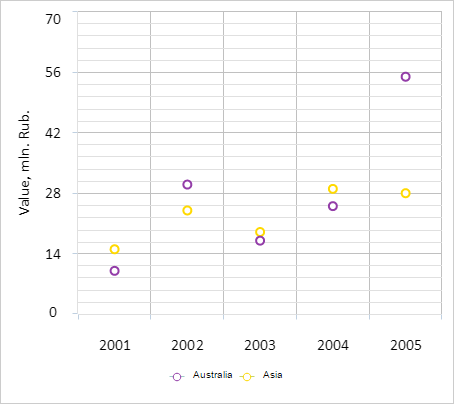
After executing the example all plot bands on Y axis are removed:
See also: