handleClick(coords: Object, event: MouseEvent);
coords. Coordinates that correspond to the current mouse pointer position over the chart.
event. Mouse event.
The handleClick method fires the event of chart axis label click.
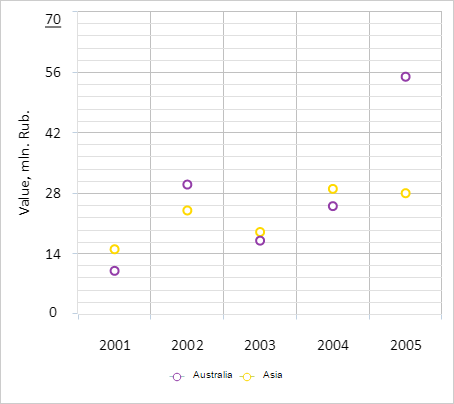
Executing the example requires that the HTML page contains the Chart component named chart (see Example of Creating a Scatter Chart). Handle the axis label click event and chart axis caption double click event:
// Get the Y axis of the chart
var yAxis = chart.getYAxis();
// Handles clicking the chart axis label
function onLabelClick(sender, args) {
    var coords = {
        X: args.Event.x,
        Y: args.Event.y
    };
    // Handle clicking the axis label
    yAxis.handleClick(coords, args.Event);
};
// Handles double click on the chart caption
function onTitleClick(sender, args) {
    var coords = {
        X: args.Event.x,
        Y: args.Event.y
    };
    // Handle double click on the chart caption
    yAxis.handleDblClick(coords, args.Event);
};
// Add a handler for the mouse click event
chart.addEvent(chart.getDomNode(), "click", onLabelClick);
// Add a handler for the mouse double click event
chart.addEvent(chart.getDomNode(), "dblclick", onTitleClick);
After executing example the chart axis label becomes underlined when clicked on:
On double click on the chart axis caption the browser console shows text of this caption:
Axis caption: Value
See also: