drawVisualLines(points: Array, lineOptions: Object, drawLine: Boolean, customValue: Number, redraw: Boolean);
points. Array of points that belong to chart data series.
lineOptions. Axis lines' settings. Optional parameter. Its value is a JSON object with the following fields: LineColor - line color, LineWidth - line width, LineStyle - line style.
drawLine. Indicates whether axis lines are drawn. Optional parameter. Available values:
true. Axis lines are drawn.
false. Axis lines are not drawn (default).
customValue. A user-defined value with an additional line drawn for it. Optional parameter.
redraw. Indicates whether chart axis is redrawn. Optional parameter. Available values:
true. Chart axis is redrawn.
false. Chart axis is not redrawn (default).
The drawVisualLines method draws axis lines for specified points of chart data series.
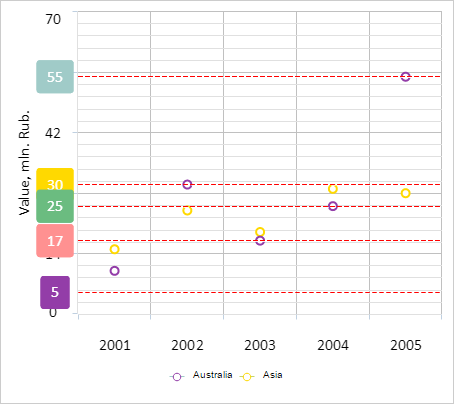
Executing the example requires that the HTML page contains the Chart component named chart (see Example of Creating a Scatter Chart). Draw Y axis lines for points of the first data series in the chart:
// Draws axis lines for each point of the first data series
function drawVisualLines(axis, serie) {
    // Get data series points
    var points = serie.getPoints();
    // Define line settings
    var lineOptions = {
        LineColor: "rgb(255, 0, 0)",
        LineWidth: 1,
        LineStyle: "dash"
    };
    /* Draw lines in the axis for each point of the first data series,
	and also for the point with the value 5 */
    axis.drawVisualLines(points, lineOptions, true, 5, true);
}
// Get Y axis in the chart
var yAxis = chart.getYAxis();
// Get the first data series
var serie = chart.getSerie(0);
// Draw Y axis lines for  each point of the first data series
drawVisualLines(yAxis, serie);
After executing the example Y axis lines are drawn for each point of the first data series. An individual line is drawn for the value five:
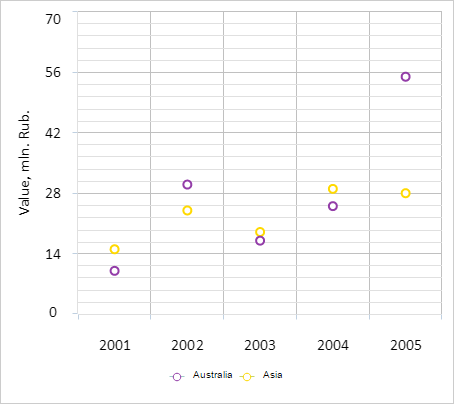
Then remove all Y axis lines:
yAxis.removeVisualLines(true);
After executing the example all lines of Y axis are removed:
See also: