DrawContext: CanvasRenderingContext2D;
The DrawContext property determines drawing context for chart axis.
The property is read-only.
Executing the example requires that the HTML page contains the Chart component named chart (see Example of Creating a Scatter Chart). Set new fill color for the chart plot area:
// Get Y axis of the chart
var yAxis = chart.getYAxis();
// Get size and paddings of the chart plot area
var plotBorders = yAxis.getPlotBorders();
// Get draw context of the chart axis
var context = yAxis.getDrawContext();
// Edit fill color for this area
context.fillStyle = "rgb(223,233,178)";
context.globalAlpha = 0.5;
context.fillRect(plotBorders.X, plotBorders.Y, plotBorders.W, plotBorders.H);
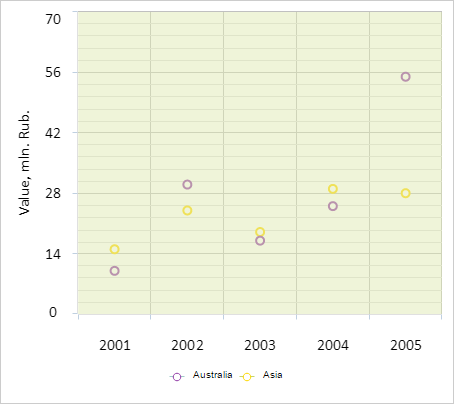
After executing the example new fill color is set for the chart plot area:
See also: