PP.Ui.ChartAxisTick(settings);
settings. JSON object that contains values of component properties.
The ChartAxisTick constructor creates an instance of the ChartAxisTick class.
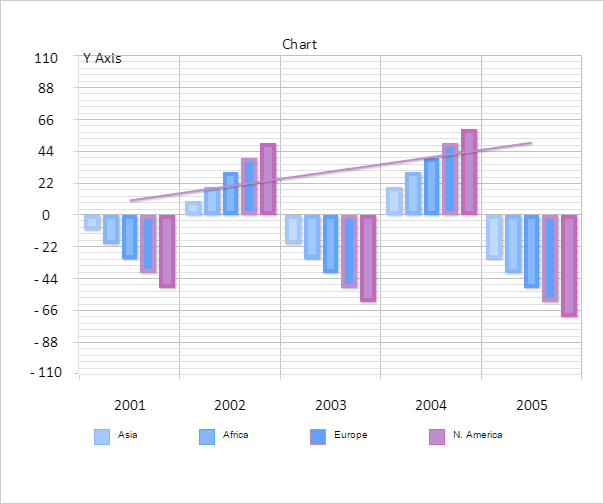
Executing the example requires that the HTML page contains the Chart component named chart (see Example of Creating the Chart Component). Create an axis label and draw this label:
// Create a chart axis label
var axisTick = new PP.Ui.ChartAxisTick({
    Parent: chart.getYAxis(),
    Left: 100,
    Top: 10,
    AxisValue: chart.getYAxis().getAxisValue()
});
// Set text value for the label
axisTick.setText("Y axis");
// Set maximum width for the label
axisTick.setMaxWidth(60);
// Draw the label
axisTick.drawSelf();
As a result, axis label is drawn in the chart:
Check if the text value overflows the specified maximum width:
// Check whether text value overflows the specified maximum width
if (axisTick.getOverflow()) {
    console.log("text value overflows limits of the maximum width");
} else {
    console.log("Text value does not overflow limits of the maximum width");
}
The result of checking is displayed in the console:
Text value does not overflow limits of the maximum width
See also: