PP.Ui.ChartSerie (settings);
settings. JSON object that contains values of component properties.
The ChartSerie constructor creates an instance of the ChartSerie class.
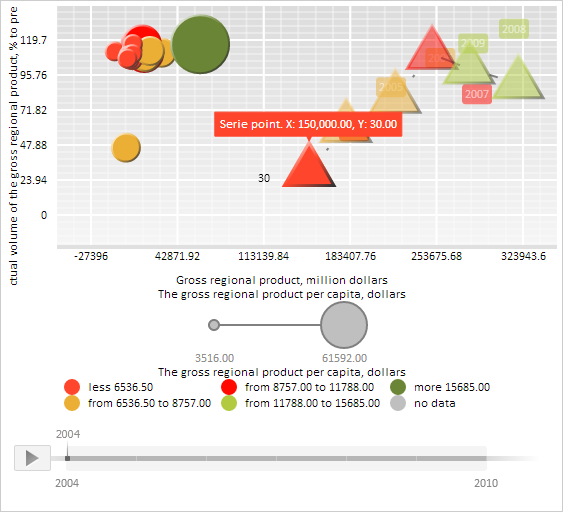
To execute this example, the HTML page must contain the BubbleChart component named bubbleChart (see Example of Creating the BubbleChart Component). Create a new data series and display it in the bubble chart:
// Get data series of data source
var series = bubbleChart.getDataSources().ds0.getSeries();
// Determine data for a new series
var newSerie = {
	DimX: new PP.TimeAxis({
		Items: ["150000", "180000", "220000", "250000", "280000", "320000", "NULL"]
	}),
	DimY: new PP.TimeAxis({
		Items: ["30", "60", "80", "110", "100", "90", "80"]
	}),
	DimR: new PP.TimeAxis({
		Items: ["55000", "46000", "36000", "26000", "16000", "260000", "36000"]
	}),
	DimCol: new PP.TimeAxis({
		Items: ["6000", "7000", "8000", "10000", "13000", "15000", "16000"]
	})
};
series["Serie28_Point0"] = newSerie;
// Determine symbol for bubble chart bubbles
var symbol = new PP.Ui.ChartSymbol({
	Chart: bubbleChart,
	// Use triangle as a symbol
	MarkerShape: PP.Ui.IntervalsLegendMarkerShape.TriangleUp,
	Thickness: 3 // Border width
});
// Create a new series
var serie = new PP.Ui.ChartSerie({
	Chart: bubbleChart,
	Index: 0, // Series index
	Label: new PP.Ui.ChartSVGLabel({ // Series text
		Text: newSerie.DimY.getItem(0).toString()
	}),
	Points: [new PP.Ui.ChartSeriePoint({ // Determine points for created series
		Id: "Serie28_Point0",
		Opacity: 1, // Make points opaque
		Value: "Series point",
		History: new PP.Ui.ChartHistory({
		Chart: bubbleChart, // bubble chart
		}),
		Symbol: symbol,
		Chart: bubbleChart
	})],
	Symbol: symbol,
	//Title: "New series", // Series title
});
// Add a new series to bubble chart array of series
bubbleChart.getSeries().push(serie);
// Display tooltip
var point = serie.getPoints()[0];
// Set timeline step
bubbleChart.setTimelineStep(3);
// Draw created series
serie.draw();
point.draw();
point.setIsHistoryOn(true);
point.renderFrame(bubbleChart.getChartArea().getPaper());
// Align history labels to the right
serie.getHistory().setIsRTL(false);
// Display  label for the first series point
serie.getLabel().setPosition(190, 210);
serie.getLabel().draw(null, bubbleChart.getChartArea().getPaper());
bubbleChart.refreshAll();
After executing the example a new series is created and displayed in the bubble chart. New data sets were predefined to plot this series.
A triangle symbol with a border three pixels wide is set for series bubble:
See also: