PP.Ui.ChartSelection(settings);
settings. JSON object that contains values of class properties.
The ChartSelection constructor creates an instance of the ChartSelection class.
To execute this example, the HTML page must contain the BubbleChart component named bubbleChart (see Example of Creating the BubbleChart Component). Select a bubble in the first data series:
// Get array of bubble chart series
var series = bubbleChart.getSeries();
// Get the first series bubble
var chartSeriePoint = series[0].getPoints()[0];
// Enable selection of bubbles in bubble chart
chartSeriePoint._selectionOn = true;
// Get selection of the specified bubble chart bubble
var oldSelection = chartSeriePoint.getSelection();
if (oldSelection != null) {
    // Hide the old selection if it is displayed
    oldSelection.hide();
}
//Create a new selection
var newSelection = new PP.Ui.ChartSelection({
    Chart: bubbleChart,
    HorizontalLine: true, // Render horizontal level line that corresponds to bubble
    HorizontalLineExtension: false, // Do not render line after the bubble
    VerticalLine: true, // Render vertical level line that corresponds to bubble
    VerticalLineExtension: true, // Continue vertical level line after the bubble
    Thickness: 4, // Selection line width
    LineType: PP.Ui.LineTypes.Dash, //Line type
    Offset: 10, // Offset of selection circle from bubble chart bubble border
    Stroke: PP.Color.Colors.lightskyblue,
    XLabel: new PP.Ui.ChartTooltip({ //Label on the X axis
        HasMask: true,
        MaskText: "{%Value:#,##.0000}"
    }),
    YLabel: new PP.Ui.ChartTooltip({ //Label on the Y axis
        HasMask: false,
        Text: chartSeriePoint.getTooltipValues().YValue.toString()
    })
});
// Determine coordinates of central bubble point
var cx = chartSeriePoint.getSymbol().getX();
var cy = chartSeriePoint.getSymbol().getY();
// Determine selection circle radius
var radius = newSelection.getOffset();
// Determine selection transparency level
var opacity = 0.8;
// Render selection
newSelection.draw(bubbleChart.getChartArea().getPaper(), cx, cy, radius, cx, cy, opacity);
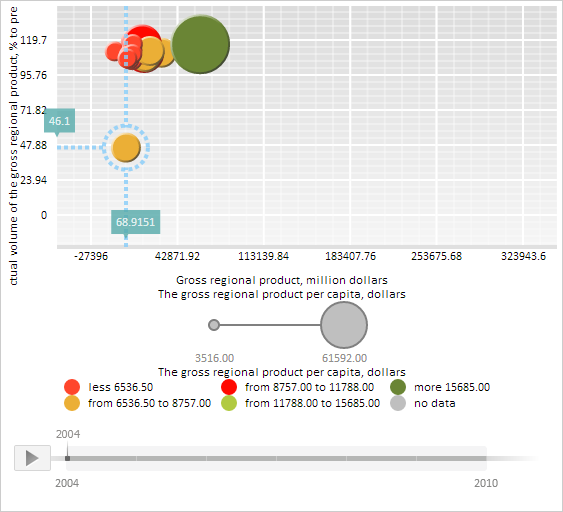
After the example execution a bubble in the first data series is selected. Selection line and level lines that correspond to this bubble, are shown as blue dashed lines four pixels wide. Labels that contain coordinate values for the selected bubble chart bubble are displayed in positions where horizontal and vertical level lines cross X and Y axes:
See also: