PP.Ui.ChartLine (settings);
settings. JSON object that contains values of class properties.
The ChartLine constructor creates an instance of the ChartLine class.
To execute this example, the HTML page must contain the BubbleChart component named bubbleChart (see Example of Creating the BubbleChart Component). In the bubble chart plot area draw a vertical level line that corresponds to the value 150.000 in the X axis:
// Create a level line in the bubble chart
var chartLine = new PP.Ui.ChartLine({
    Chart: bubbleChart,
    Stroke: PP.Color.Colors.lightblue, // Blue color
    Thickness: 3, // Level line width
    Value: 150000 // Value, to that corresponds level line
});
// Draw the created level line in the bubble chart
chartLine.draw(bubbleChart.getChartArea().getPaperArea(), PP.Ui.VisualType.X);
// Get coordinates of level line by X and Y axes
console.log("Level line coordinate by the X axis: " + chartLine.getPrimaryCoord(PP.Ui.VisualType.X));
console.log("Level line coordinate by the Y axis: " + chartLine.getPrimaryCoord(PP.Ui.VisualType.Y));
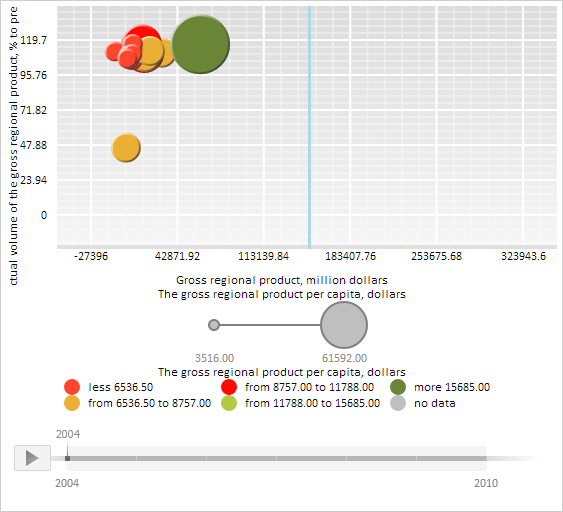
After executing the example a vertical level line corresponding to the value 150.000 in the X axis is drawn in the bubble chart plot area. Line color is light blue, width is set to 3 pixels:
The browser console shows coordinates of created line:
X coordinate of level line: 251.61758708668194
Y coordinate of level line: -219089.24561403508
See also: