PP.Ui.ChartGrid (settings);
settings. JSON object that contains values of class properties.
The ChartGrid constructor creates an instance of the ChartGrid class.
To execute this example, the HTML page must contain the BubbleChart component named bubbleChart (see Example of Creating the BubbleChart Component). Render a new coordinate grid in the bubble chart:
// Delete the old bubble chart coordinate grid
bubbleChart.getChartArea().getGrid().dispose();
// Create a new coordinate grid
var grid = new PP.Ui.ChartGrid({
    // Set smooth fading of lines on changing coordinate zoom
    SmoothDisappear: true,
    Chart: bubbleChart,
    // Set coordinate grid border style
    BorderBrush: new PP.SolidColorBrush({
        Color: PP.Color.Colors.darkgrey, // Dark grey color
        Enabled: true,
        Opacity: 1 // Opaque border
    }),
    BorderThickness: 2, // Border width
    // Display all borders
    Bottom: true,
    Left: true,
    Right: true,
    Top: true,
    // Determine horizontal and vertical bubble chart gridlines
    Horizontals: PP.Ui.ChartArea.DEFAULT_HORIZONTALS,
    Verticals: new PP.Ui.ChartGridLineCollection({
        // Collection of main vertical lines
        Chart: bubbleChart,
        LineType: "solid", // Solid line type
        IntervalsCount: "5", // Number of intervals created by lines
        Stroke: PP.Color.Colors.lightgray, // Light grey color
        SubLines: {
            // Collection of additional vertical lines
            LineType: "dash", // Dash line
            IntervalsCount: "2",
            Stroke: PP.Color.Colors.white,
            Thickness: "1",
        },
        Thickness: "2" // Line width
    })
});
// Render a coordinate grid in bubble chart
grid.draw(bubbleChart.getChartArea().getPaperArea());
// Add borders to coordinate grid
grid.toFront();
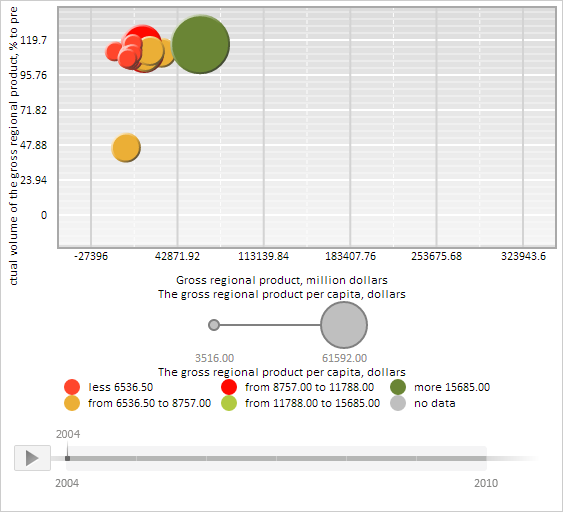
After executing the example a new coordinate grid with dark gray opaque borders is rendered in the bubble chart.
Horizontal grid lines have default settings.
Major vertical lines have the following settings: light gray color, solid type, width equal to 2 pixels, and the number of intervals formed by the lines, is set to 5. Minor vertical lines have the following settings: two intervals, white fill color, dashed line type, and width equal to one pixel:
See also: