PP.Ui.ChartAxis(settings);
settings. JSON object that contains values of component properties.
The ChartAxis constructor creates an instance of the ChartAxis class.
To execute this example, the HTML page must contain the BubbleChart component named bubbleChart (see Example of Creating the BubbleChart Component). Create and display a new Y axis for the bubble chart:
// Get bubble chart area
var chartArea = bubbleChart.getChartArea();
// Get the Y axis
var axisY = chartArea.getAxisY();
// Delete Y axis object
axisY.dispose();
// Determine axis title
var axisCaption = new PP.Ui.ChartLabel({
    Text: "New text of Y axis"
});
// Determine axis labels
var axisMarkers = new PP.Ui.MarkerCollection({});
// Determine axis brush
var stroke = new PP.SolidColorBrush({
    Color: "#3366FF"
});
// Determine constructor parameters
var settings = {
    AutoMax: true,
    AutoMin: true,
    AxisCrossValue: 0,
    Caption: axisCaption,
    Markers: axisMarkers,
    Stroke: stroke,
    Thickness: 1,
    Type: PP.Ui.VisualType.Y,
    Chart: bubbleChart
};
// Create a new axis object
var newAxisY = new PP.Ui.ChartAxis(settings);
// Set a new axis object
chartArea.setAxisY(newAxisY);
// Render contents of new axis object in the left label area
newAxisY.draw(chartArea.getPaperArea());
// Display bubble chart bubbles with no data
newAxisY.setShowBubblesWithNoData(true);
// Refresh bubble chart
bubbleChart.refresh();
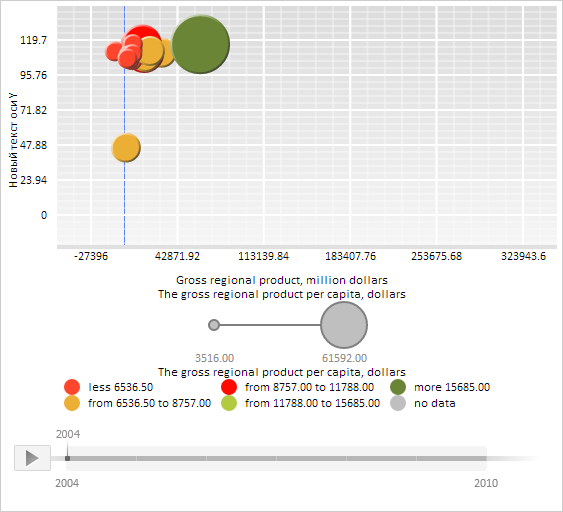
After executing the example a new Y axis is created and displayed for the bubble chart:

See also: