MaxValue: Number
The MaxValue property determines maximum value of bubble chart axis.
Use the setMaxValue method to set the property value, and the getMaxValue method to get the property value. Property value cannot be set from JSON.
To execute this example, the HTML page must contain the BubbleChart component named bubbleChart (see Example of Creating the BubbleChart Component). Set new maximum and minimum values for the Y axis, and get axis offset from bubble chart edge:
// Get bubble chart area
var chartArea = bubbleChart.getChartArea();
// Get the Y axis
var axisY = chartArea.getAxisY();
// Set maximum value of axis
axisY.setMaxValue(150);
// Set new minimum axis value
axisY.setMinValue(30);
// Refresh chart
bubbleChart.refresh();
// Calculate axis offset from bubble chart edge
var offset = axisY.calcOffset();
// Output obtained data
console.log("Offset of the Y axis from bubble chart edge: " + offset);
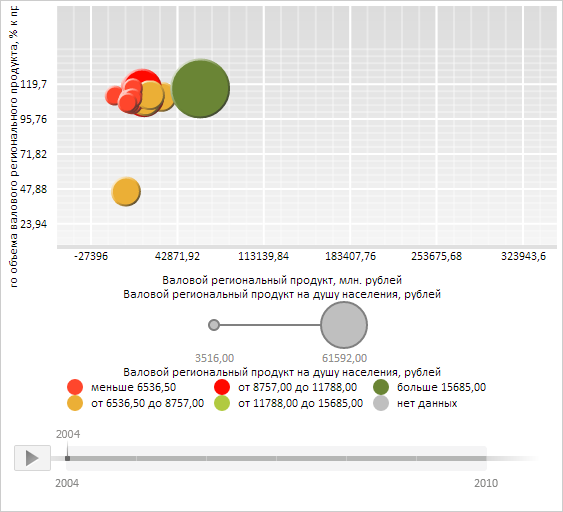
After the example execution new maximum and minimum values are set for Y axis:
The browser console also displays value of the Y axis offset from bubble chart edge:
Y axis offset from bubble chart edge: 37
See also: