AxisX: PP.Ui.ChartAxis
The AxisX property determines X axis of bubble chart plot area.
Use the setAxisX method to set the property value, and the getAxisX method to get the property value. Property value cannot be set from JSON.
To execute this example, the HTML page must contain the BubbleChart component named bubbleChart (see Example of Creating the BubbleChart Component). Hide text of X and Y axes labels, show left and right borders of the plot area grid, show the plot area grid over the bubbles, and rerender the bubble chart plot area and axes:
// Get bubble chart plot area
var chartArea = bubbleChart.getChartArea();
// Get X and Y axes of bubble chart plot area
var xAxis = chartArea.getAxisX();
var yAxis = chartArea.getAxisY();
// Hide label text of X and Y axes
xAxis.getCaption().setIsVisible(false);
yAxis.getCaption().setIsVisible(false);
// Assign new values for X and Y axes
chartArea.setAxisX(xAxis);
chartArea.setAxisY(yAxis);
// Get bubble chart grid
var grid = chartArea.getGrid();
// Display left and right grid borders
grid.setLeft(true);
grid.setRight(true);
// Display plot area grid over bubbles
chartArea.setIsGridBefore(true);
// Set new grid value
chartArea.setGrid(grid);
// Refresh bubble chart
bubbleChart.refresh();
// Rerender plot area and axes of bubble chart
chartArea.drawWithoutResize();
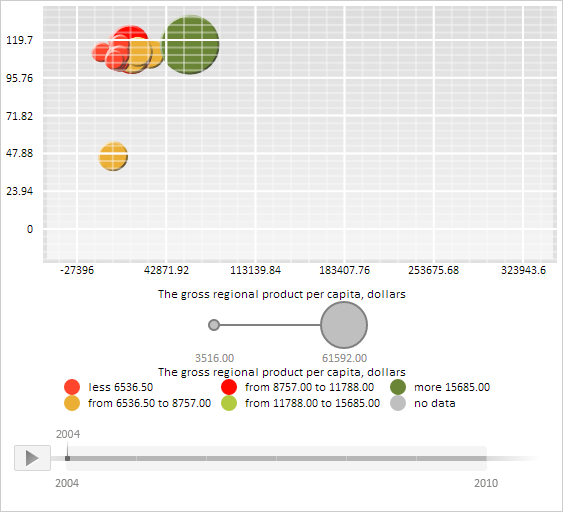
After executing the example text of X and Y axes labels is hidden in the bubble chart area, left and right borders of the plot area grid are shown, and the plot area grid is shown over the bubbles:
See also: