RVisual: PP.SizeVisual;
The RVisual property contains settings for mapping series values with size of the bubble chart bubbles that correspond to this data.
Use the setRVisual method to set the property value, and the getRVisual method to get the property value. Property value cannot be set from JSON.
To execute this example, the HTML page must contain the BubbleChart component named bubbleChart (see Example of Creating the BubbleChart Component). Change minimum and maximum data values in the legend that describes size of bubble chart bubbles:
// Determine bubble chart area to correctly refresh it
bubbleChart.setChartArea({
    Axes: bubbleChart.getChartArea().getAxes()
});
/* Get settings for mapping series values with
sizes of chart bubbles corresponding to this data. */
var rVisual = bubbleChart.getRVisual();
// Set minimum and maximum size of bubble chart bubbles
var scale = rVisual.getNumericMapping().getScale();
scale._MinValue = 1000;
scale._MaxValue = 100000;
// Apply new settings
bubbleChart.setRVisual(rVisual);
// Refresh the bubble chart
bubbleChart.refresh();
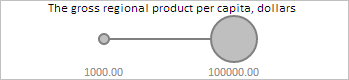
After executing the example the minimum value of 1.000 and the maximum value of 100.000 are set in the legend that describes size of bubble chart bubbles:
See also: