TicksOnZeroLine: Boolean;
The TicksOnZeroLine property determines whether tick marks are displayed on a zero line.
The property is relevant only for category axis (X axis). To use the property, enable showing zero line on the Y axis.
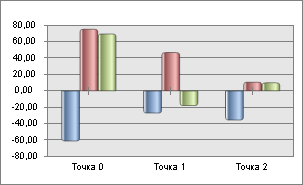
The property is set to False by default, and tick marks are displayed only on the category axis (X axis). If the property is set to True, tick marks are displayed on the line that crosses the value axis (Y axis) at zero point. If value axis (Y) contains minimum and maximum that are certainly less than zero or certainly greater than zero, tick marks are displayed on the category axis (X).
The example of displaying tick marks on a zero line:

Executing the example requires a regular report, which sheet contains a chart. A unit is added to the report, and the user can use a hyperlink to call the GetChart procedure from this unit. The inspector of unit assemblies must contain links to the Chart, Report, Tab system assemblies.
Sub GetChart;
Var
chart: IChart;
objs: ITabObjects;
Begin
objs := (PrxReport.ActiveReport.ActiveSheet As IPrxTable).TabSheet.Objects;
chart := objs.Item(0).Extension As IChart;
chart.AxisY.IncludeZero := True;
chart.AxisX.TicksOnZeroLine := True;
End Sub GetChart;
After clicking the hyperlink, using zero line and displaying zero line tick marks are set for the value axis.
See also: