DisplayAxisLine: Boolean;
The DisplayAxisLine property determines whether chart axis lines are displayed.
Available values:
True. Chart axis lines are displayed.
False. Chart axis lines are not displayed.
To execute the example, place on the form two Button, ChartBox and UiErAnalyzer components named BUTTON1, BUTTON2, CHARTBOX1 and UIERANALYZER1, respectively. For the ChartBox component set the Source property toUiErAnalyzer1. In the Button1 component set the Text property to Hide Line, in the Button2 component set the Show Line value. For the UiErAnalyzer component set the Active property to True. There should be an express report specified as the Object property for the UiErAnalyzer component.
Add links to the Chart, Drawing, Express, and Forms system assemblies.
Sub Button1OnClick(Sender: Object; Args: IMouseEventArgs);
Var
Chart: IChart;
ChartAxisX: IChartAxis;
Begin
Chart := ChartBox1.Chart;
ChartAxisX := Chart.AxisX;
ChartAxisX.DisplayAxisLine := False;
End Sub Button1OnClick;
Sub Button2OnClick(Sender: Object; Args: IMouseEventArgs);
Var
Chart: IChart;
ChartAxisX: IChartAxis;
Begin
Chart := ChartBox1.Chart;
ChartAxisX := Chart.AxisX;
ChartAxisX.DisplayAxisLine := True;
ChartAxisX.AxisPen := New GxPen.CreateSolid(GxColor.FromName("Red"), 2.0);
End Sub Button2OnClick;
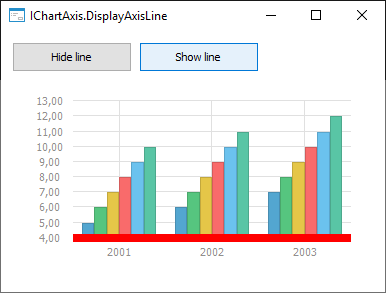
After clicking the Show Line button the line is shown on the X axis:
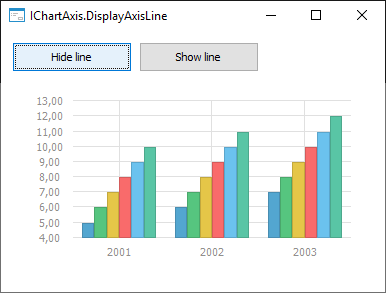
After clicking the Hide Line button the line is hidden on the X axis:
See also: