Select the
 Gantt Chart item in the drop-down menu of the
  Plugins button on the Home or Insert ribbon tab.
Select the New Block > Plugins > Gantt Chart item in the dashboard's context menu.
Tool interfaces in the web application and in the desktop application are identical, and differences in functionality are given in appropriate comments.
The Gantt Chart plugin is used to display data as a histogram that allows for executing calendar and network scheduling.
Calendar and network scheduling is the tool that is used to create a project implementation plan and analyze task execution deadlines to optimize overall project implementation time. Network scheduling allows for creating the best project task execution plan in short time and determining the critical tasks which affect negatively the overall project calendar duration.
A project is a system of interrelated tasks with determined deadlines and project objective.
NOTE. The plugin is available only in the web application.
To insert the plugin:
Execute one of the operations:
Select the Gantt Chart item in the drop-down menu of the ![]() Plugins button on the Home or Insert ribbon tab.
Plugins button on the Home or Insert ribbon tab.
Select the New Block > Plugins > Gantt Chart item in the dashboard's context menu.
Select data source on the Report side panel tab. The tab displays all data sources in the repository available for the plugin. Select the corresponding element in the tree of objects to select or change the data source.
An express report is used as a data source. When creating an express report take into account the following:
Make sure that the data source contains a dimension with task data and their execution deadlines. To determine execution deadlines, the dimension should contain two additional attributes Start (START_DATE) and End (END_DATE) with the Date or Date and Time data type.
Place the dimension with tasks in rows and enable displaying of the Start and End attributes.
Use only one fact. Fact values determine task execution progress in percents. The range of available values: [0, 1]. To specify task execution time in days, use the <number of executed days>*100/<task duration in days>. For example, task duration is five days, task execution time is three days, as a result, the fact value is 0.6 - 60%.
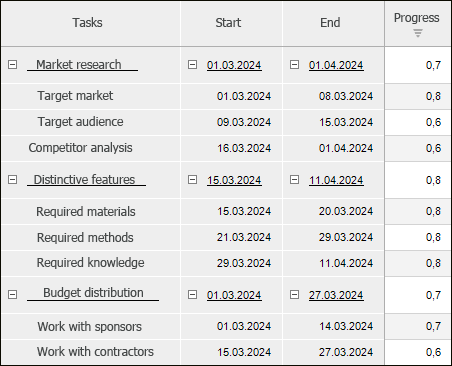
The example of express report with plugin data:
After executing the operations the plugin is inserted to the dashboard as a single object.
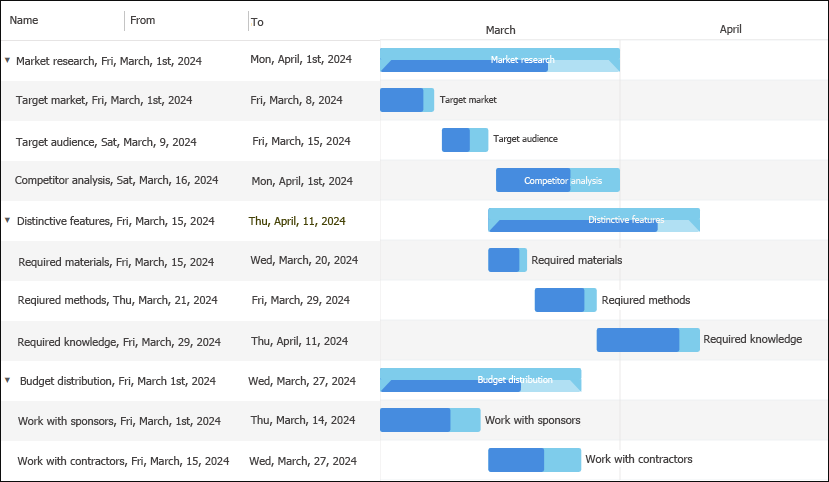
The example of the Gantt Chart plugin:
All operations with objects described in the Building Dashboard section are available for Gantt charts.
Use the Format side panel tab to set up the Gantt Chart plugin formatting. To display the tab:
Make sure that the side panel is displayed.
Select the Gantt Chart plugin in the working area.
Go to the Format tab.
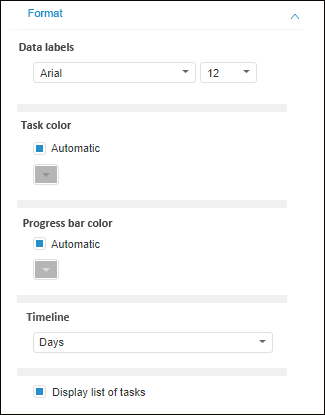
Set the parameters:
Data Labels. Set font options:
Font. Select one of the fonts available in the operating system in the drop-down list.
Font Size. Set the required font size. The size is set in points, and it can be selected in the drop-down list or entered manually. The range of available values: [1, 72].
Task Color/Progress Bar Color. Select task color and progress bar color fill option:
Automatic. Deselect the checkbox to select color manually. The checkbox is select by default and automatic color is used.
Manual. Select color in the drop-down color palette if the Automatic checkbox is deselected.
Timeline. Select progress frequency in time option:
Years.
Quarters.
Months.
Days. Default value.
Display List of Tasks. Deselect the checkbox to hide the list of tasks in the plugin. The checkbox is selected by default, and the list of tasks is displayed.
See also:
Inserting and Setting Up Plugins