 Data series of the entire chart
Data labels can be set up for various chart components:

 Data series of the entire chart
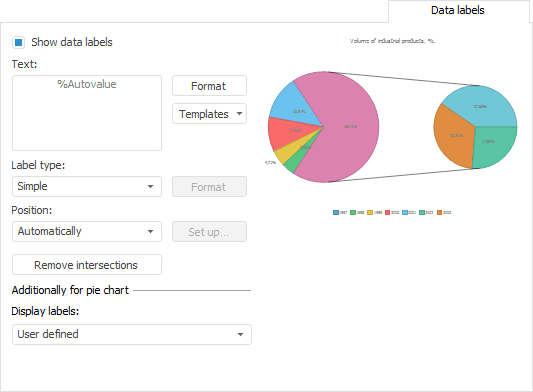
To set up data series label of the entire chart, use the Data Labels tab of the Chart Parameters dialog box. To call the dialog box, select the Chart Parameters item in the context menu of the selected chart.
NOTE. In the Dashboards tool select the Chart > Chart Parameters item in the chart context menu.
To quickly setup data labels for the chart click the  Data Labels button in the View group of the Chart tab of the tool ribbon. Select label position option in the drop-down menu of the button. Selecting the Additional Parameters option opens the Chart Parameters dialog box on the Data Labels tab.
NOTE. In the web application, the Additional Parameters menu item is not available. To set up labels, select the Data Labels Settings option, clicking on which opens the Series tab of the side panel.
To set up data series label, use the Data Labels tab of the Data Series Format dialog box. To call the dialog box:
Select the Data Series Format item in the context menu of the selected series.
NOTE. In the Dashboards tool select the Chart > Data Series Format item in the series's context menu.
Double-click the series.
In the regular report to set up chart series format, select data series. In the Select a Chart Element for Formatting drop-down list on the Chart ribbon tab select the item corresponding to data series name, and click the Fragment Style button. The Data Series Format dialog box opens.
To quickly set up series data labels, use the Data Series side panel tab.
To set up data labels of one series point, use the Data Labels tab of the Data Series Point Format dialog box. To call the dialog box:
Select a data series point and execute of the operations:
Select the Data Series Point Format item in the data series point context menu.
NOTE. In the Dashboards tool select the Chart > Data Series Point Format item or Chart > Data Label Format item in the context menu of data series point.
Double-click the series point.
Select the data series point label and select the Data Label Format item in the data series point label context menu. The item is available, if data series labels are shown.
For waterfall charts, to set up data labels for one point, use the Points side panel tab.
To set up level line labels, use the Levels tab of the Axis Format dialog box. To call the dialog box:
Select the chart axis and select the Axis Format item in the chart axis's context menu.
NOTE. In the Dashboards tool select the Chart > Axis Format item in the axis's context menu.
Double-click the caption of the selected axis.
To set up chart axes parameters in the regular report, select a chart axis. In the Select a Chart Element for Formatting drop-down list on the Chart ribbon tab, select the X Axis item (Y Axis, Secondary Axis) and click the Fragment Style button. The Axis Format dialog box opens
NOTE. Data labels can be set up using this dialog box only in the desktop application.

The set of parameters on the tab may differ depending on the chart type and from where the dialog box opens.
The following operations are available for data labels:
To show labels:
Click the  Data Labels button located in the View group of the Chart ribbon tab and select the required label location option.
Select the Show Data Labels checkbox on the Data Labels tab.
Select the Show Data Labels checkbox in the Chart Types dialog box.
To hide labels:
Click the  Data Labels button located in the View group of the Chart ribbon tab and select the No label location option.
Deselect the Show Data Labels checkbox on the Data Labels tab.
Deselect the Show Data Labels checkbox in the Chart Types dialog box.
To set the text shown in the data label for a chart, series or a series point, use the Text box on the Data Labels tab in the Chart Parameters, Data Series Format and Data Series Point Format dialog boxes respectively.
The Text box is multiline.
To edit or add a template to the label text:
Click the Templates button next to the Text box.
Select one of the available data label text templates in the drop-down list.
To set up format of:
Label text part, select a text fragment and select the Format context menu item.
Whole data label, click the Format button.
After that the Label Format dialog box opens. Label format is set up in the same way as the caption format.
NOTE. Select the entire templates. If a part of text is not selected in the Text box, format settings are applied to the whole label text.
To set up label format, set parameters in the Label Format dialog box.
To determine the type of chart data labels, series or series point, use the Label Type drop-down list of the Chart Parameters, Data Series Format and Data Series Point Format dialog boxes, respectively.
Select the required type of data label displaying in the Label Type list:
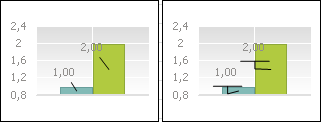
Simple. The label is displayed as a mark not connected to the series (default).
Callout. The label is displayed as a callout connected to the series with a line.
Pointer. The label is displayed as a pointer connected to the series with a line.
Example of using a pointer (left) and callout (right) to label the chart series:

The line connecting the label with the data series is named a callout or pointer line and becomes visible when the label is offset relative to the series.
Click the Format button to set up format of the line that connects the series to its data label. The Callout Line Format/Pointer Line Format dialog box opens.
Depending on the selected chart type the Position drop-down list enables the user to select various options of of data label position:
The Automatically, Center and Other Settings options are available for all series types.
The following options are available for a column and a sector: Inside End, Outside End, Inside Base.
The following options are available for a line, area and point: Right, Left, Top and Bottom.
To define data label offset, when the label position is set to Other Settings, click the Set Up button. The Set Up Label Position dialog box opens.
To prevent chart, series, or series point data labels from intersecting, use the Remove Intersections button on the Data labels tab in the Chart Parameters, Data Series Format, and Data Series Point format dialog boxes, respectively.
NOTE. Preventing of data labels from intersecting is applied once after clicking the Remove Intersections button. If chart settings are changed, data labels may again intersect with each other. To avoid data label intersection, click the Remove Intersections button again or use automatic data label layout option.
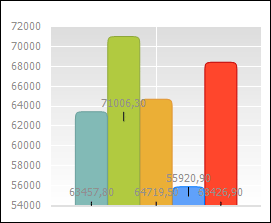
When the automatic position is used, the labels are positioned to avoid overlapping. Automatic label position is saved along with other report parameters. When the automatic position is used, manual label position (set with the mouse) is reset if the labels overlap.
NOTE. Automatic position removes overlapping for the labels that follow one another. For example, after automatic position is applied, the first and the second labels certainly will not overlap, but the first and the third labels may overlap.
See below examples of data label layout without using automatic position (left) and using it (right).


NOTE. Data label layout can be defined using the Fore language or manually. To manually change data label layout, select this label in the chart and drag the label to the required position as an object.
To automatically position data labels for a chart, series or series point, use the Additionally for Pie Chart group in the Data Labels tab of the Chart Parameters dialog box.
In the Show Labels drop-down list select how to display the data series labels on charts.
For Both Charts. Labels are shown for both charts.
For the Main Only. Labels are shown only for the primary chart.
TIP. To quickly hide data labels in the secondary chart, select the View Mode > Hide Labels on the Secondary Chart item in the chart's context menu.
For the Secondary Only. Labels are shown only for the secondary chart.
See also:
Data Labels | Setting Up General Chart Parameters | Setting Up Chart Components