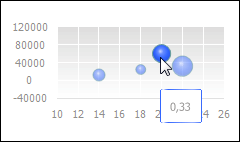
Tooltips show information on a data series point when the user points the cursor to it.
See below an example of a tooltip:

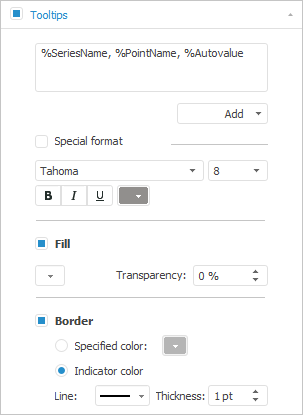
The following approaches are used to set up tooltips:
To display tooltips, select the Tooltips checkbox in the Tooltips side panel tab.

After the tooltips displaying is enabled in the chart plot area, the following operations become available:
See also:
Setting Up Tooltips | Templates | Setting Up General Chart Parameters | Setting Up Chart Components