Open the Foresight Analytics Platform mobile application.
Create a new connection by clicking the  button:
Before getting started with the application make sure that your device meets the system requirements.
To get started with Foresight Analytics Platform:
Download the Foresight Analytics Platform mobile application from App Store.
NOTE. Use the same version of published or loaded reports of the desktop and mobile applications.
Open the Foresight Analytics Platform mobile application.
Create a new connection by clicking the  button:

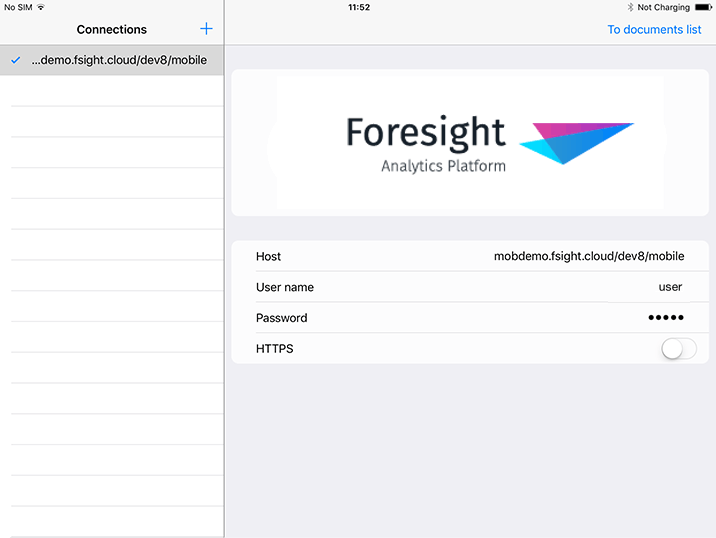
Set server connection parameters:
Host. Specify the path to the mobile application container on the server where it was published, if required, write port number.
User Name. Specify repository user name.
Password. Specify repository password.
HTTPS. Use the switch button if it is required to use HTTPS protocol.
Click the Go to Documents button or double-click the server in the Connections list.
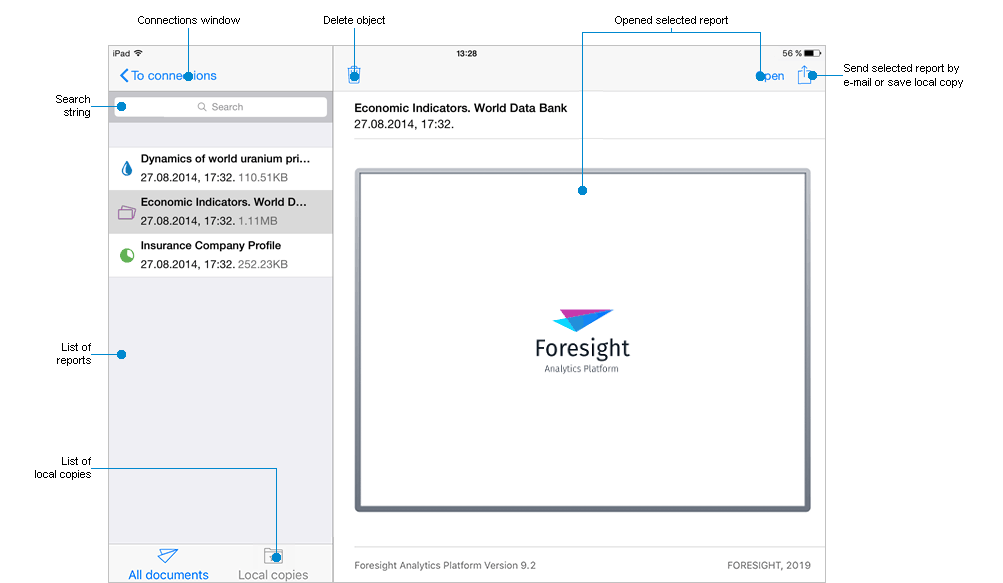
In case of successful connection to server, the main page opens:

The main page displays a list of loaded and available for loading repository objects.
The object type can be indicated by the icon:
 .
Dashboard.
The date of creating a report in the desktop application and object size are displayed under the report name.
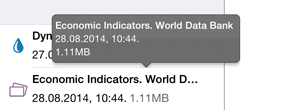
To display a full object name, select and hold down the object. A tooltip appears:

To load and update reports, see the Loading and Updating Reports article.
To get started with express reports, see the Getting Started with the Analytical Queries (OLAP) Tool article.
To get started with dashboards, see the Getting Started with the Dashboards Tool article.
To get started with reports, see the Getting Started with the Reports Tool article.
Requirements to mobile device:
| Requirements | |
| Device | iPad 4 or later. |
| Free memory volume | 2 Gb or more. |
| Operating system | iOS 8.0 or later. |
| Browser | Apple Safari for iOS 5.0 or later. |
| Other | Access to network with BI server. |
System requirements to database server and BI server, to which mobile application container is published can be found on the System Requirements page in description of mobile application container.
See also:
Quick View and Data Analysis (OLAP) | Working with Dashboards | Viewing Report for Printing | Loading and Updating Reports