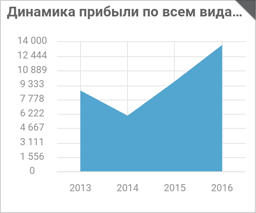
A dashboard built using the Dashboards tool in the desktop and web applications enables the user to view created analytical documents as a combination of interactive interrelated visualizers.
NOTE. Before building dashboards in the desktop application, refer to dashboards building guidelines to display correctly on a tablet.
To view a dashboard, select it in the object navigator. After the operation is executed, the dashboard opens:

 Open dashboard in other formats
NOTE. Displaying of dashboard and working with visualizer depend on specified settings on building a dashboard in the desktop or web application of Foresight Analytics Platform.
To change repository, tap the Logout button in the drop-down menu of the  button. After the operation is executed, the login dialog box opens.
To view an object in full-screen mode:
Tap the triangle at the top right block corner:

Tap the  button.
After the operations are executed, the selected object is displayed in full screen mode.
To minimize the object to the original size:
tap the triangle at the top right block corner.
Tap the  button.
After the operations are executed, the object is displayed in the dashboard in its original size.
Dashboards support working with interrelated visualizers: Table, Chart, Map, Bubble Chart, Bubble Tree, Tree Map.
To facilitate working with a data visualizer, maximize the object to fit the full screen.
NOTE. Visualizers are displayed depending on the settings determined on building a dashboard in the desktop and web applications, and access permissions of the user.
Working with visualizers:
See also:
Mobile Application Based on Foresight Mobile Platform | Dashboards and Reports Building Guidelines | Working with Object Navigator | Viewing Pixel-Perfect Reports