To correctly display dashboards on tablets, set up formatting in the desktop application taking into account recommendations for reports and dashboards building.
NOTE. Report and dashboard display with configured formatting for mobile application can be different on viewing in web application.
Depending on formatting options, create several copies of reports and dashboards in the object navigator.
Set up formatting in report or dashboard copy:
After executing actions, calculate the size of operating memory in use and check defined formatting display on iOS and Android tablets.
To display fonts in the same manner on viewing report and dashboard in the desktop and mobile application, select fonts, which analogs are available on iOS and Android tablets. By default, Tahoma font is used and it is displayed correctly only on Android mobile tablets. On iOS tablets, a font is changed from Tahoma to Times New Roman.
TIP. Use the fonts: Arial, Trebuchet MS.
A collection of text formatting elements (font parameters, paragraph, filling and other elements) determines text style. On setting up text formatting, use from 5 to 8 styles.
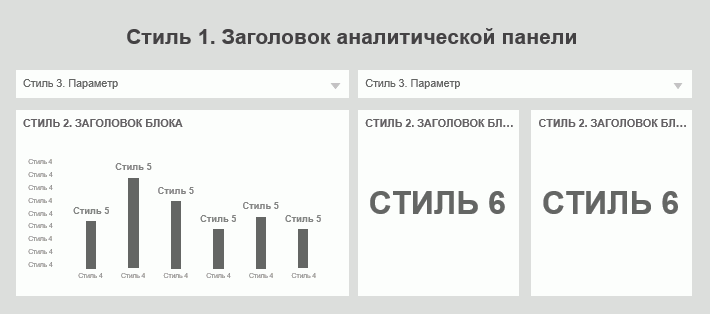
To correctly display dashboard blocks, set up text styles:
Dashboard title. Delete block with dashboard title and rename dashboard in the object navigator and rename dashboard in the object navigator according to required title to reduce title size on the tablet screen. On viewing dashboard, the title will be displayed on navigation panel.
Block title. Setup layout of each dashboard block title in one line, top or bottom with text alignment to center or to left edge.
Main text. Set up main text formatting and interactive controls.
Auxiliary text. Set up formatting of axis labels, legend, tooltips and other auxiliary text. Text font size must be less or equal to the main text size.
Data labels. Change font size of chart data labels to display all values. Set up label position in order that values do not overlap each other.
Indicator. Change font size of indicator label to fully display numeric values.
The table provides recommended parameter values basing on Arial and Trebuchet MS fonts:
| Font style | Description | Font size, pt | Style | RGB color |
Style 1 |
Dashboard title |
12 - 18 20 - 22 |
Bold Standard |
65 65 65 76 76 76 |
| Style 2 | Block title | 9 - 11 | Bold Bold + Caps Lock |
76 76 76 102 102 102 |
| Style 3 | Main text | 6 - 10 | Standard | 76 76 76 102 102 102 |
| Style 4 | Auxiliary text | 6 - 10 | Standard | 145 143 141 |
| Style 5 | Data labels | 8 - 11 | Bold | 76 76 76 102 102 102 |
| Style 6 | Indicator | 22 - 32 | Bold | 76 76 76 |
Style distribution schema:

To display charts correctly:
Select the Position Automatically checkbox to automatically locate plot area inside chart. Plot area will be located to the chart center and will be automatically resized on changing chart size.
Use the value zoom to decimal or hundredth parts. Multiple number will be transformed to the short value, for example, 1653212436 will be transformed to 1.65 bln. Use also the specified zoom in block title or in data labels.
Set value format, for example, for numbers - numeric format using thousands separator, for percents - percent format or use manually spaces between digit order numbers, percent characters and other measurement units.
Use the grid lines by Y value axis or by X category axis:
On using X axis set the number from 5 to 7.
On using Y axis set the number equal to the number of categories.
TIP. Set RGB line color 230 230 230 on using the white background color of chart.
Take the data labels out the plot area to display correctly chart data.
Place legend bottom center. Legend formatting must be the same inside one dashboard.
After executing the actions, report and dashboard charts will be correctly displayed on a tablet.
To view observation objects of visualizers for a specific time period, use one selected element of calendar dimension. Frequency of observation objects changing using timeline is used for reports presentation and dashboards in the desktop and web application and it is not relevant for view on a tablet.
When building reports and dashboards for mobile devices, take into account operating memory that is used by report or dashboard. To view reports on a tablet, use no more than 80% of tablet operating memory. For example, a tablet has 1Gb of operating memory, 800 Mb are taken by mobile application.
To calculate operating memory in use:
Open report or dashboard in web application.
Open the Task Manager dialog box in browser using SHIFT+ESC.
NOTE. Use browser supporting task manager.
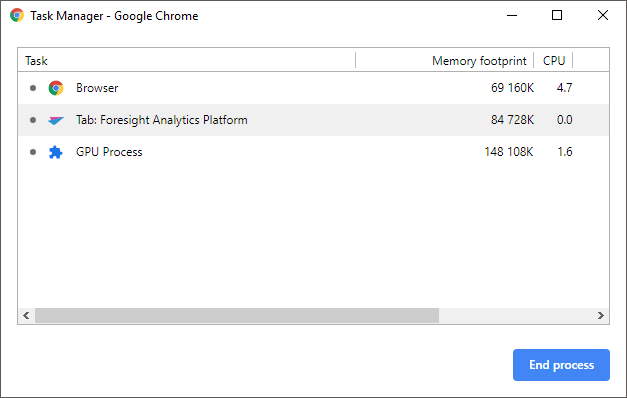
For example, task manager in Google Chrome:

After executing the actions, sum up memory consumption of the tab with opened report and GPU process memory. The total memory should not exceed 80% of tablet operating memory.
See. also:
Mobile Application Based on Foresight Mobile Platform | Viewing Dashboards