Adding Object or Report from Repository
In this article:
On working the add-in, it is possible to refresh from repository:
Reports:
Express report
Workbook
Regular report
NOTE. Only one report from from repository can be added to the document.
Objects:
Table. It shows source data as a table
Chart. It shows source data as graphic
Map. Shows source data as a territory map and displays detailed characteristics for regions
NOTE. A map can be inserted if the report contains other objects.
Expression. The report element calculated based on source data or a custom formula.
NOTE. Several objects can be added to the document.
After report or objects have been added to the document, go to the step:
Adding Reports
After selecting report from repository in the object selection dialog box, the report will be added to the document.
Inserting Table or Chart
Parameters for inserting a table and a chart are the same.
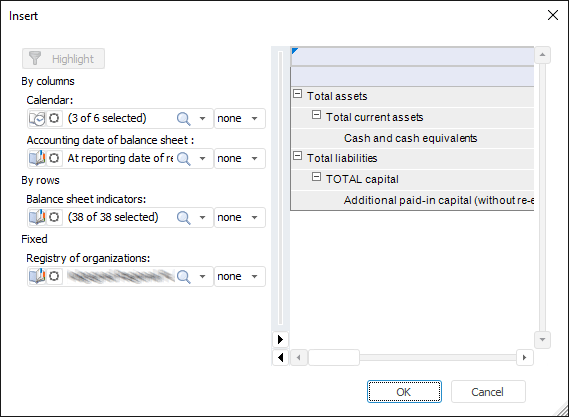
After the data source has been selected, the Insert dialog box opens:

The dialog box has two areas:
Dimension area. The area contains all data source dimensions and is divided into categories:
By Columns. Dimensions, which elements are displayed in data table columns.
By Rows. Dimensions, which elements are displayed in data table rows
Fixed. Dimensions, which elements are fixed and not displayed in the table
Table/chart area. The area displays a preview of a table or chart plotted on the current dimension parameters.
The dimension setup includes:
Dimension Type. It is indicated with icon:
 . Calendar dimension.
 . Dictionary-based dimension.
 . Table MDM dictionary based dimension.
Dimension Parameters. To set up dimension parameters, click the
 button. The Dimension Parameters dialog box opens.
Dimension Selection. To manage dimension selection, use the drop-down list. To work with the selection of dimension elements, use context menu items described in the Changing Selection in Dictionaries section. To search for dimension elements:
Click the
 button.
Select the Search String item in the context menu of the dimension element list.
A detailed search description is given in the Searching for Dictionary Elements section.
Selection Synchronization. Synchronization is used to set the same element selection in matching dimensions of different data sources. To set synchronization, assign the same indexes (# 1, # 2, # 3, and so on) to the dimensions, which selection is to be changed synchronously: when selection of one dimension is changed, it is copied to the dimensions with the same synchronization index. Synchronization is not used by default, and the None element is selected in the list of synchronization indexes
Dimension Category. To change the category, hover the mouse pointer over the dimension icon and hold down the left mouse button. Drag the dimension to the required category
Formatting. To apply table formatting from data source, select the Insert with Formatting checkbox. If the checkbox is deselected, data source formatting settings are not applied to the table.
Features of Table Insert
If a chart is selected on the Report Objects panel, clicking the ![]() Table button inserts a table based on the same selection of dimension elements as in the chart.
Table button inserts a table based on the same selection of dimension elements as in the chart.
If a table with a large number of columns is inserted, the error message stating that incorrect range of inserted table is selected pops up.
Features of Chart Insert
If a table is selected on the Report Objects, clicking the ![]() Chart button inserts the chart based on the same selection of dimension elements as in the table.
Chart button inserts the chart based on the same selection of dimension elements as in the table.
Inserting Map
A map can be inserted if a report contains data sources.
To insert a map, click the ![]() Map button in the Insert group on the Foresight ribbon tab. A dialog box for topobase selection opens.
Map button in the Insert group on the Foresight ribbon tab. A dialog box for topobase selection opens.
After selecting a topobase, the Map Properties dialog box opens, used to set up map and indicators parameters.
Requirements for Map Data Source
A map data source must include a territory dimension. This dimension must be the first dimension displayed in rows.
Inserting Expression
Depending on the selected expression insertion method, the following options are available:
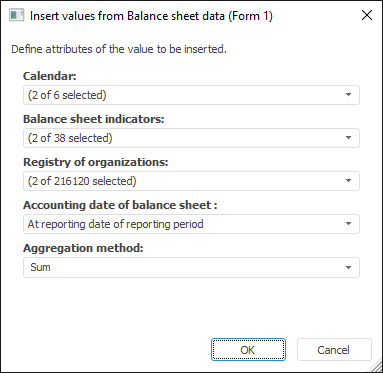
- Expression basing on the source data. To create an expression based on source data, use the Insert Values From dialog box:

The dialog box includes:
Data Source Dimensions. Set elements selection, based on which the expression should be calculated, by selecting elements from the drop-down list. To work with the selection of dimension elements, use context menu items described in the Changing Selection in Dictionaries section
Aggregation Method. The parameter is available if multiple element selection is set in one of the dimensions. Select one of value aggregation methods. Available aggregation methods: sum, minimum, maximum, number of non-empty, number of empty, number of all children, average, actual mean, first actual, last actual, root-mean square deviation based on sample, median, root-mean-square-deviation, number of different values.
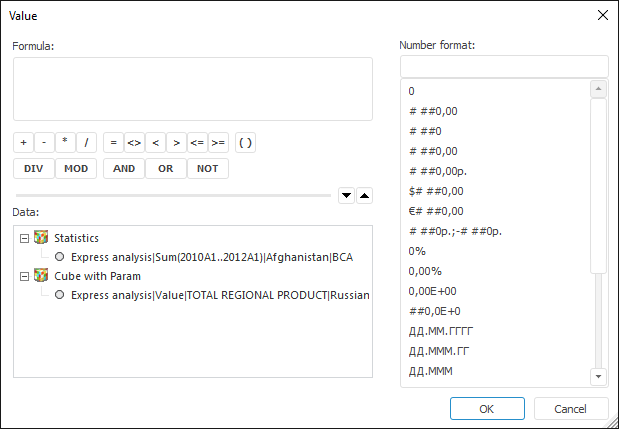
- Expression Based on Custom Formula. Create an expression based on a custom formula by using the Value dialog box:

The dialog box includes the areas:
Formula. The area is used to create a formula for calculating an expression. Any arithmetic operations, numbers, signs of comparison and round brackets can be used in a formula. It is available to create an expression by typing required symbols on keyboard, using data area and corresponding operator buttons.
Data. It contains data source-based expressions created in the current report. Existing expressions can be used to create a formula to calculate a custom expression. To insert existing expression to the formula, double-click the required expression. To expand or collapse the expression hierarchy, select the Collapse Entire Hierarchy/Expand Entire Hierarchy item in the area context menu.
Number Format. It is used to set the format of the output value. Select the required format in the list of available formats.
Deleting Object
To delete an object:
Select the required object in the report, then:
Select the Delete Content Control item in the object's context menu
Press the DELETE key
Select the element that corresponds to the required object on the Report Objects panel and select the Delete item in the context menu of the element.