 Create a data area
How to set up displaying of data area cell value in percents to subtotal?
Total values can be displayed for any data area. Sometimes it is required to display not the cell value itself, but its percentage to subtotal of the corresponding level or to grand total. This calculation type can be set up only for separate columns or rows and when several dimensions are placed in rows or columns. To make this point more visual, it is possible to set up displaying in such a way that some columns or rows display absolute values, and some display percentage.
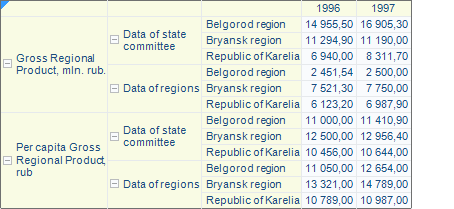
The data area looks as follows:

See below two solutions:
 All columns show percents to subtotal
 The columns show alternating absolute values and percents
See also: