removePanelsByGroup(groupName);
groupName. Name of the group being removed.
The removePanelsByGroup method removes panels by name of the group, to which they belong.
To execute the example the HTML page must contain links to following files:
PP.css - visual styles.
jquery.js - jquery library.
highcharts.src.js - highcharts library.
PP.js - library of basic components of Foresight Analytics Platform.
PP.ChartMaster.js - chart wizard.
resources.ru.js - resources file.
options.js - file with json settings of the chart, created by developer, seee example on theExample of the File with the HighCharts Chart Settings page.
In the <body> tag of the HTML document it is necessary to put the table for chart and master:
<body onselectstart="return false" class="PPNoSelect" onload="onReady()">
    <table style="width: 100%">
        <tr>
            <td valign="top" width="350" id="chartM">
            </td>
            <td valign="top" id="tdChart">
            </td>
        </tr>
    </table>
</body>
Code of the example must be placed in the <script> tag. Create and display chart and master to setup it:
// Create a chart
chart = new Highcharts.Chart(options);
// Create a chart master
master = new PP.Ui.ChartMaster({
    // Set parent item
    ParentNode: "chartM",
    // Set chart
    Chart: chart,
    // Set sizes
    Height: 500,
    Width: 300,
    // Set path to the folderwith icons
    ImagePath: "../build/img/" //path to the folder with images
});
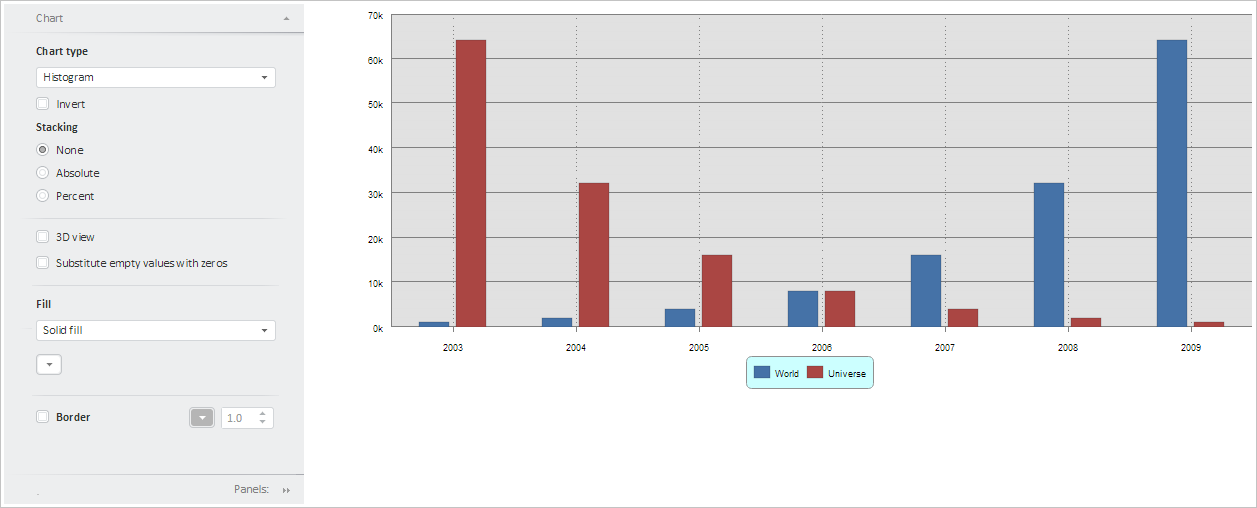
As a result the chart and setup master are displayed:

Get active panel of the master and remove it:
// Get active panel of the master
var panel = master.getActivePanel();
// Remove the panel
master.removeMasterPanel(panel);
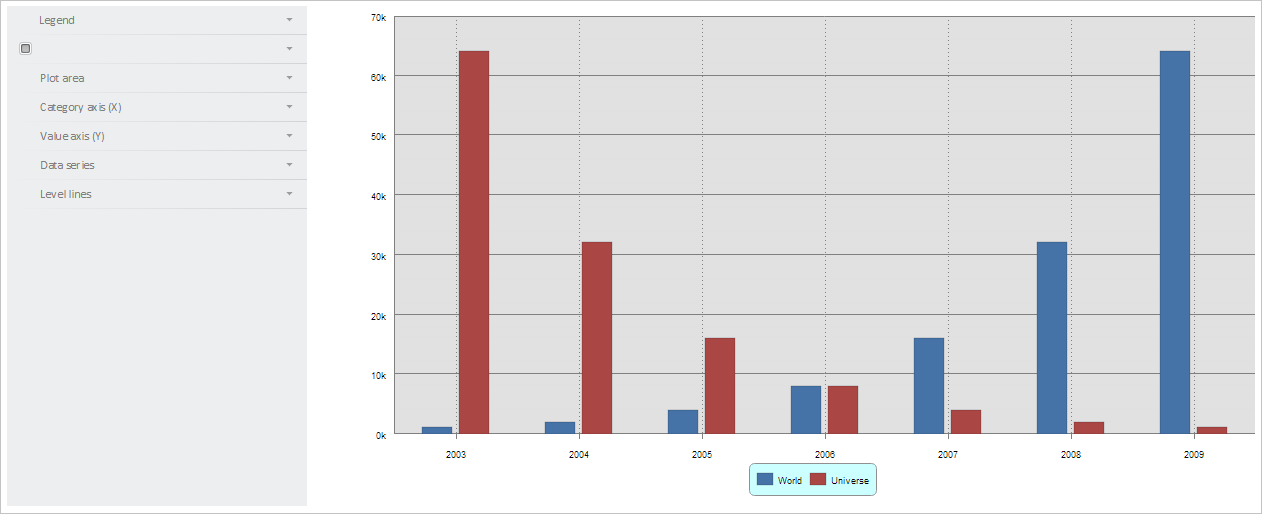
As a result, the panel named Chart is removed from the master:

Insert removed panel in the master, after all panels:
// Add removed panel in the master
master.addMasterPanel(panel);
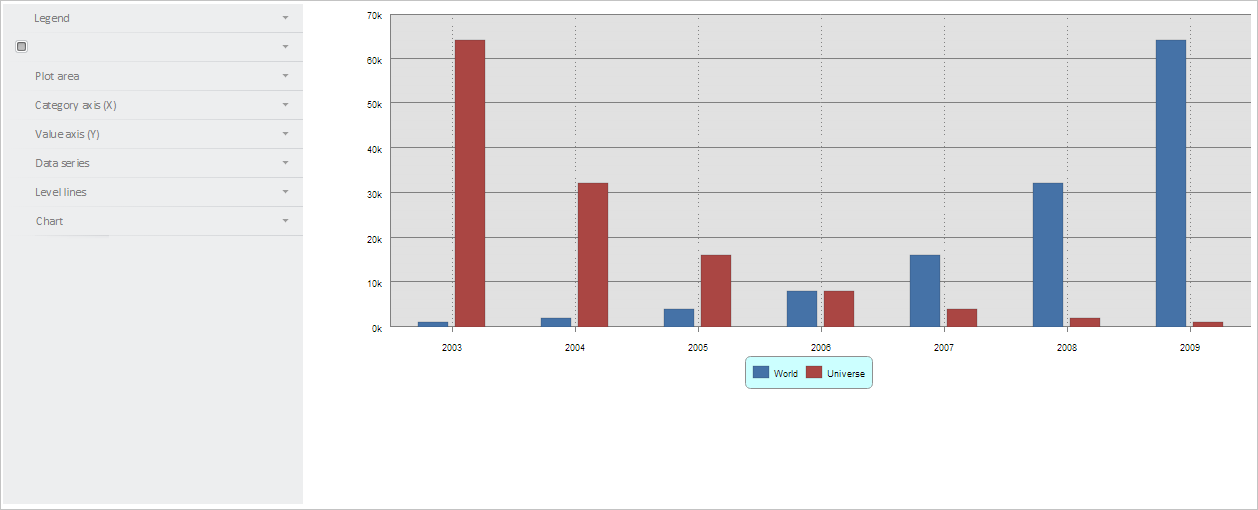
As a result removed panel is added to the master:

Change the name of the group named Chart and remove all other panels which are in the Chart group:
// Change panel group
panel.setGroupName("NewChart");
// Remove all other panels
panel.removePanelsByGroup("Chart");
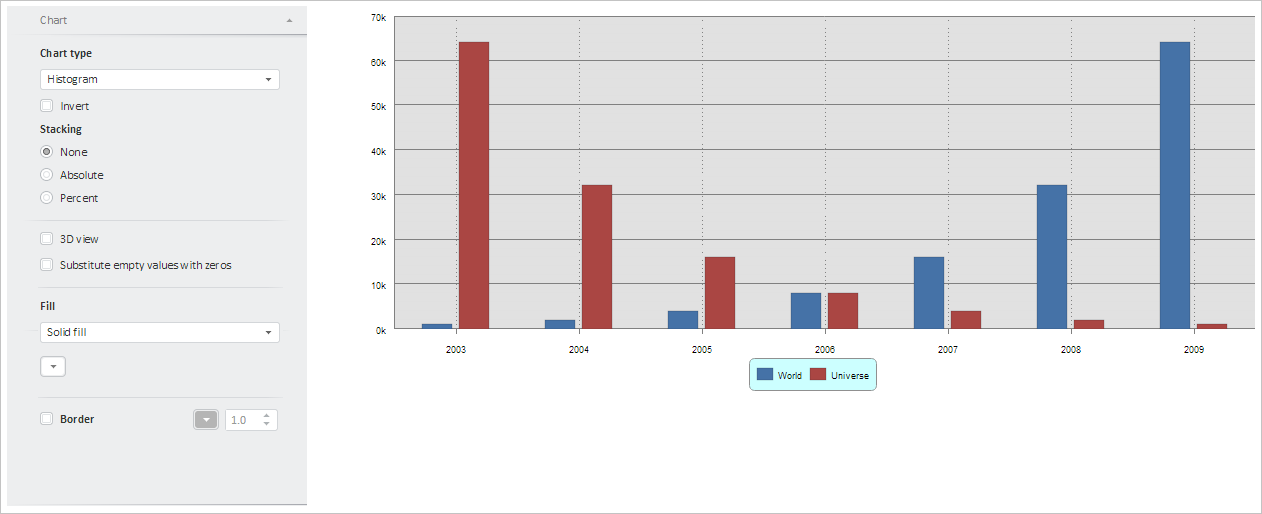
As a result master contains only one panel named Chart:

See also: