This page gives an example of a *. JS file that contains HighCharts settings
var options = {
    "chart": {//basic settings of the chart
        "backgroundColor": "rgba(255, 255, 255, 1.000000)",
        "borderColor": "rgba(128, 128, 128, 1.000000)",
        "borderRadius": 0,
        "borderWidth": 0.944882,
        "defaultSeriesType": "column",
        "plotBackgroundColor": "rgba(225, 225, 225, 1.000000)",
        "plotBorderColor": "rgba(128, 128, 128, 1.000000)",
        "plotBorderWidth": 1,
        "renderTo": "tdChart",
        "seriesOrder": "forward",
		animation: false
    },
    "legend": {//legend settings
    	"align": "center",
		"floating": false,
        "backgroundColor": "#ccffff",
        "borderColor": "#909090",
        "borderWidth": 1,
        "enabled": true,
        "itemStyle": {
            "color": "#000000",
            "fontFamily": "Arial",
            "fontSize": 9.44882,
            "fontStyle": "normal",
            "fontWeigth": "normal",
            "textDecoration": "none"
        },
        "layout": "horizontal",
        "verticalAlign": "bottom"
    },
    "plotOptions": {//settings of the chart plot area
        "series": {
            "connectNulls": true,
            "dataLabels": {
                "align": "center",
                "enabled": false,
                "formatter": "%y",
                "rotation": 0,
                "style": {
                    "color": "#000000",
                    "fontFamily": "Arial",
                    "fontSize": 9.44882,
                    "fontStyle": "normal",
                    "fontWeigth": "normal",
                    "textDecoration": "none"
                }
            },
            "marker": {
                "enabled": false
            },
            "stacking": null
        }
    },
    "series": [//data series
    {
        "borderColor": "rgba(20, 27, 36, 0.501961)",
        "borderPenEnabled": true,
        "borderWidth": 0.377953,
        "brushEnabled": true,
        "dashStyle": "solid",
        "data": [1000, 2000, 4000, 8000, 16000, 32000, 64000],
        "dataIndex": 0,
        "dataLabels": {
            "align": "center",
            "enabled": false,
            "formatter": "%y",
            "rotation": 0,
            "style": {
                "color": "#000000",
                "fontFamily": "Arial",
                "fontSize": 9.44882,
                "fontStyle": "normal",
                "fontWeigth": "normal",
                "textDecoration": "none"
            }
        },
        "legendIndex": 1,
        "lineColor": "rgba(81, 111, 147, 1.000000)",
        "linePenEnabled": true,
        "lineWidth": 1.51181,
        "marker": {
            "enabled": true,
            "fillColor": null,
            "lineColor": "#909090",
            "lineWidth": 0,
            "radius": 5.66929,
            "symbol": "circle"
           },
        "name": "World",
        "shadow": false,
        "showInLegend": true,
        "zIndex": 1
       }, {
       	"borderColor": "rgba(20, 27, 36, 0.501961)",
       	"borderPenEnabled": true,
       	"borderWidth": 0.377953,
       	"brushEnabled": true,
       	"dashStyle": "solid",
       	"data": [64000, 32000, 16000, 8000, 4000, 2000, 1000],
       	"dataIndex": 0,
       	"dataLabels": {
       		"align": "center",
       		"enabled": false,
       		"formatter": "%y",
       		"rotation": 0,
       		"style": {
       			"color": "#000000",
       			"fontFamily": "Arial",
       			"fontSize": 9.44882,
       			"fontStyle": "normal",
       			"fontWeigth": "normal",
       			"textDecoration": "none"
       		}
       	},
		trendLines: [],
       	"legendIndex": 1,
       	"lineColor": "rgba(81, 111, 147, 1.000000)",
       	"linePenEnabled": true,
       	"lineWidth": 1.51181,
       	"name": "Universe",
       	"shadow": false,
       	"showInLegend": true,
       	"zIndex": 1
       }],
    "title": {//title
        "style": {
            "backgroundColor": "#ffffff",
            "borderColor": "#909090",
            "borderStyle": "solid",
            "borderWidth": 0,
            "color": "#000000",
            "fontFamily": "Arial",
            "fontSize": 18.6667,
            "fontStyle": "normal",
            "fontWeigth": "normal",
            "textDecoration": "none"
        },
        "text": ""
    },
    "tooltip": {//tooltip
        "enabled": true
    },
    "xAxis": {//X axis
        "categories": ["2003", "2004", "2005", "2006", "2007", "2008", "2009"],
        "gridLineColor": "rgba(128, 128, 128, 1.000000)",
        "gridLineDashStyle": "dot",
        "gridLineWidth": 1.33333,
        "labels": {
            "align": "center",
            "enabled": true,
            "rotation": 0,
            "spacing": true,
            "style": {
                "color": "#000000",
                "fontFamily": "Arial",
                "fontSize": 9.44882,
                "fontStyle": "normal",
                "fontWeigth": "normal",
                "textDecoration": "none"
            }
        },
        "lineColor": "rgba(128, 128, 128, 1.000000)",
        "lineWidth": 0.377953,
        "tickColor": "rgba(128, 128, 128, 1.000000)",
        "tickWidth": 0.377953,
        "tickmarkPlacement": "on",
        "title": {
            "style": {
                "backgroundColor": "#ffffff",
                "borderColor": "#909090",
                "borderStyle": "solid",
                "borderWidth": 0,
                "color": "#000000",
                "fontFamily": "Arial",
                "fontSize": 13.2283,
                "fontStyle": "normal",
                "fontWeigth": "bold",
                "textDecoration": "none"
            },
            "text": ""
        }
    },
    "yAxis": {//Y axis
        "gridLineColor": "rgba(128, 128, 128, 1.000000)",
        "gridLineDashStyle": "solid",
        "gridLineWidth": 0.944882,
        "labels": {
            "align": "right",
            "dataFormat": "# ##0,00",
            "enabled": true,
            "rotation": 0,
            "spacing": true,
            "style": {
                "color": "#000000",
                "fontFamily": "Arial",
                "fontSize": 9.33333,
                "fontStyle": "normal",
                "fontWeigth": "normal",
                "textDecoration": "none"
            }
        },
        "lineColor": "rgba(128, 128, 128, 1.000000)",
        "lineWidth": 0.377953,
        "max": null,
        "min": null,
        "tickColor": "rgba(0, 0, 0, 1.000000)",
        "tickInterval": null,
        "tickWidth": 0,
        "title": {
            "style": {
                "backgroundColor": "#ffffff",
                "borderColor": "#909090",
                "borderStyle": "solid",
                "borderWidth": 0,
                "color": "#000000",
                "fontFamily": "Arial",
                "fontSize": 13.2283,
                "fontStyle": "normal",
                "fontWeigth": "bold",
                "textDecoration": "none"
            },
            "text": ""
        },
        "type": "linear"
    }
};
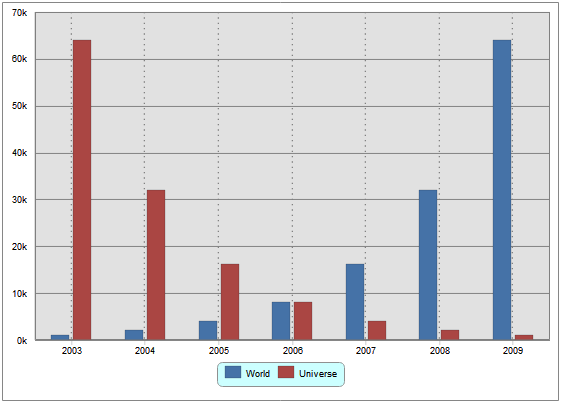
A chart with the settings listed above looks as follows:
See also:
The HighCharts Chart Allocation on HTML Page | Example of Using ChartMaster to Set Up a HighChart